
When you were a child did you ever play the Memory game? I remember playing it with my parents and friends for hours on end, eventually wearing them out. The game begins by turning all playing cards upside down, and then each player takes a turn to flip over two cards, attempting to find a match. By the end of the game, the person with the most matching pairs wins.

The game was simple and fun, and in hindsight, is similar in concept to our investment process. While writing this update, I’m reflecting on how complex our world is today. We have wars, countries facing food shortages, bank failures, political polarization, stock market volatility, and more. With such complexity, I believe this backdrop offers a great opportunity to remind all BLUE LINE INVESTING® clients how our process attempts to use the simplicity of the Memory game when making investment decisions.
As a refresher to what I wrote in Protecting The Pig: How Stock Market Trends Reveal the Way to Grow and Preserve your Wealth, the financial markets can be categorized into one of three primary trends. Trends are either Rising, Declining, or Sideways (consolidating). Let’s take a quick look at historical examples before trying to find a potential match to today.
THE S&P 500 1995-1999 PRIMARY TREND: RISING
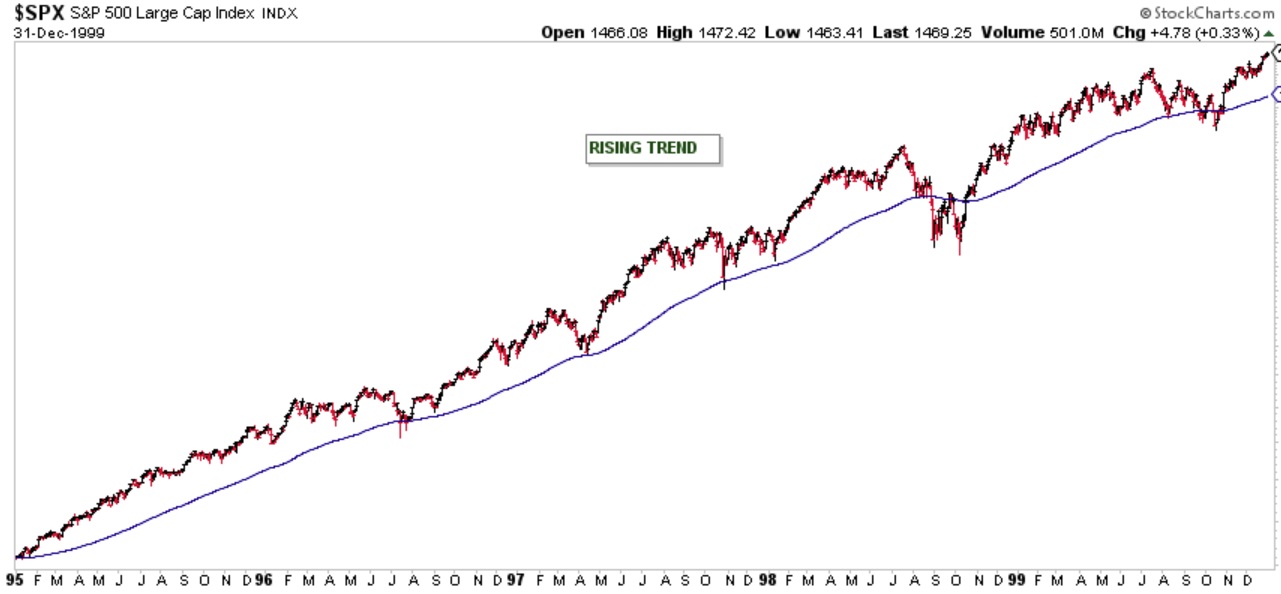
Chart courtesy of StockCharts.com
The chart above shows the S&P from 1995 through 1999. You will notice that one of the characteristics of a Rising Trend is that Price tends to remain above the BLUE LINE.
THE S&P 500 2000-2003 PRIMARY TREND: DECLINING
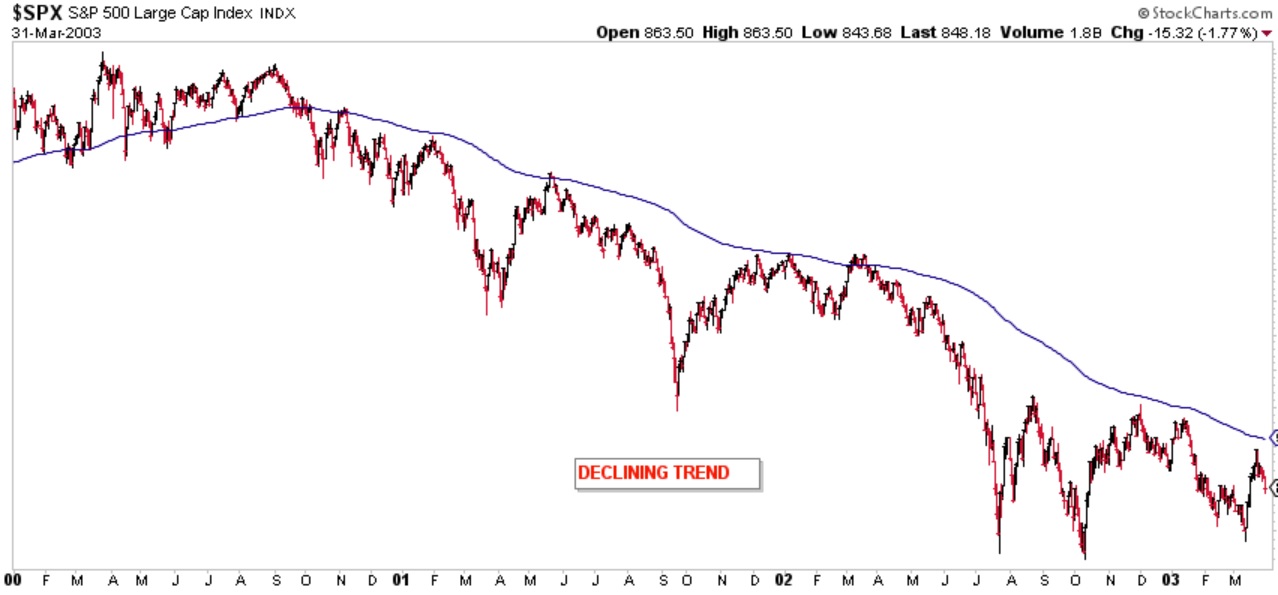
Chart courtesy of StockCharts.com
The chart above shows the S&P from 2000 into 2003. You will notice that one of the characteristics of a Declining Trend is the exact opposite of the Rising Trend: Price remains below the BLUE LINE.
THE S&P 500 1946-1949 PRIMARY TREND: SIDEWAYS (Correcting)
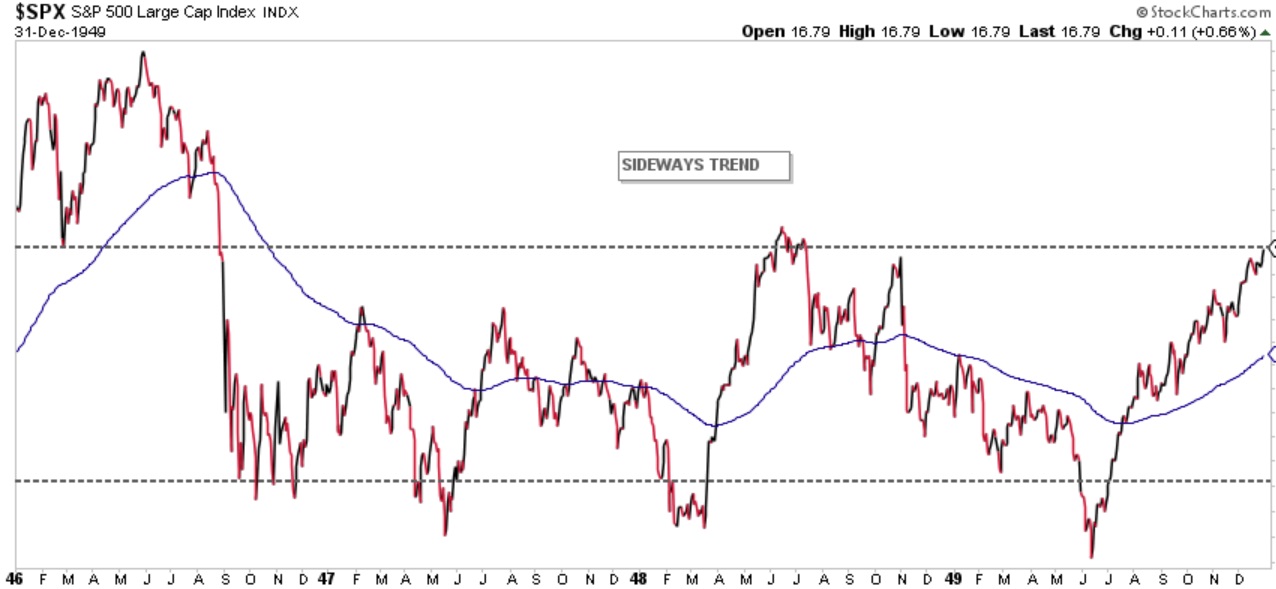
Chart courtesy of StockCharts.com
Finally, the chart above shows the S&P from 1946 through 1949. You will notice that one of the characteristics of a Sideways Trend is that price bounces up and down through the BLUE LINE.
Let’s now take a closer look at the S&P as of the end of March and see if we can find a match.
THE “BLUE LINE”: A CLOSER LOOK
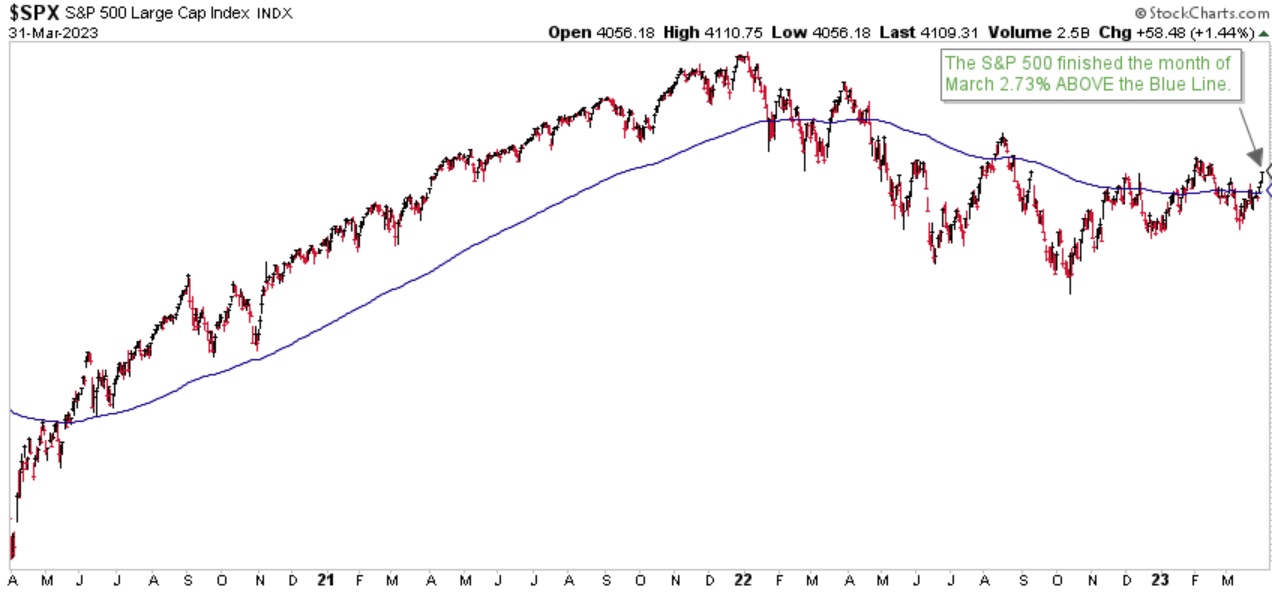
Chart courtesy of StockCharts.com
Through March 2023, I believe the closest match at this time would be a Sideways Trend. As you can see from the chart above, the S&P is not currently in either an established Rising or Declining Trend. While waiting for the market to provide us with more evidence of what we might expect to happen in the future, we will continue to follow our investment process and play the matching game.
The S&P finished the month of March 2.73% above the Blue Line, compared to 1.00% below the Blue Line at the end of February. Thank you for reading this update, and to our existing clients, for your continued trust and confidence.
Jeff Link
Disclaimers:
The BLUE LINE INVESTING® (BLI) investment process was founded on over 95 years of stock market history. It seeks to identify and align investment decisions with multiyear trends. Various aspects of this process have been illustrated in my book Protecting The Pig: How Stock Market Trends Reveal the Way to Grow and Preserve Your Wealth.
The S&P 500 Index is one of the most commonly followed equity indices, and many consider it one of the best representations of the U.S. stock market, and a bellwether for the U.S. economy. It is comprised of 500 large companies having common stock listed on the NYSE or NASDAQ. The volatility (beta) of the account may be greater or less than the index. It is not possible to invest directly in this index.
Technical analysis is a method of evaluating securities by analyzing statistics generated by market activity, such as past prices and volumes. Technical analysis attempts to predict a future stock price or direction based on market trends. The assumption is that the market follows discernible patterns and if these patterns can be identified then a prediction can be made. The risk is that markets may not always follow patterns. There are certain limitations to technical analysis research, such as the calculation results being impacted by changes in security price during periods of market volatility. Technical analysis is one of many indicators that may be used to analyze market data for investing purposes and should not be considered a guaranteed prediction of market activity. The opinions expressed are those of BLI. The opinions referenced are as of the date of publication and are subject to change without notice. BLI reserves the right to modify its current investment strategies based on changing market dynamics or client needs.
Past performance is not indicative of future results. This material is not financial advice or an offer to sell any product. The information contained herein should not be considered a recommendation to purchase or sell any particular security. Forward looking statements cannot be guaranteed.
Guardian Wealth Advisors, LLC (“GWA”) is an investment adviser registered with the U.S. Securities and Exchange Commission. Registration does not imply a certain level of skill or training. More information about GWA’s investment advisory services can be found in its Form CRS or Form ADV Part 2, which is available upon request.
GWA-23-30

