
In last month’s update, I illustrated the three primary trends that almost every publicly traded investment experiences throughout its existence. The reason I believe it is imperative to have this understanding and awareness is because investment profits result from aligning our investment decisions, and strategy, with the prevailing trend in motion. Whenever an investor loses money after making an investment, it is typically the result of having invested contrary to the trend. In other words, they buy when the trend suggests not to.
In this update I will clarify a previous comment. Last month I said I believed the current primary trend was a sideways trend, but I misspoke. I should have said I believe the secondary trend is a sideways trend. Believe it or not, trends exist within trends. Let me show you what I mean.
THE S&P 500 PRIMARY TREND: RISING
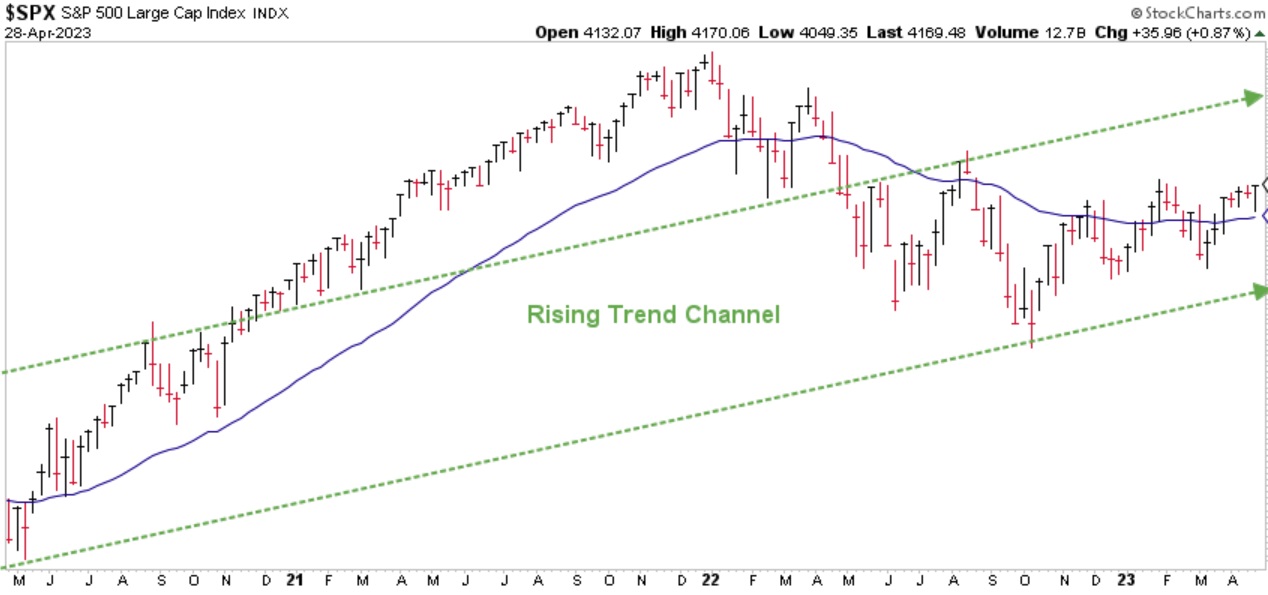
Chart courtesy of StockCharts.com
A version of the chart above was illustrated in the January 2023 update. As we ended calendar year 2021, the S&P had broken out above the identified rising trend channel. But during 2022 the market experienced a channel correction. The S&P subsequently lost approximately 18% of its value, and as you can see, prices fell below and remained below the Blue Line for most of the year.
Fast forward to the end of April and we see for the first time since June of 2020, prices are once again beginning to rise above the Blue Line which is encouraging. The only question now is whether prices will remain above it. Now look at the information above from a slightly different perspective.
THE S&P 500 SECONDARY TREND: SIDEWAYS
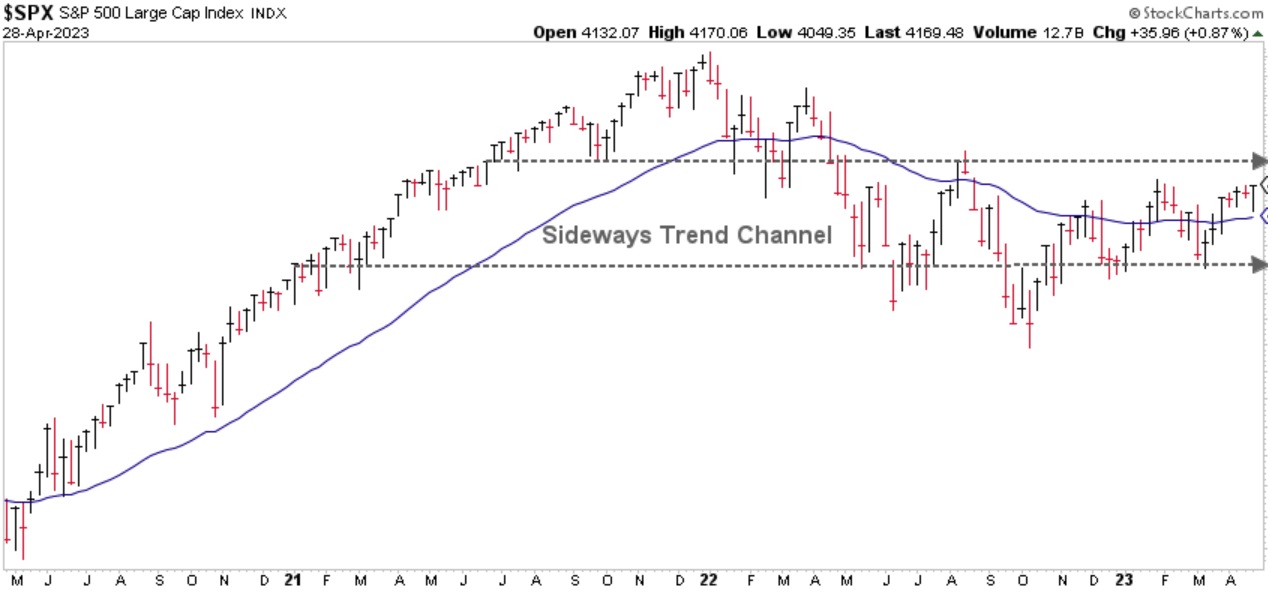
Chart courtesy of StockCharts.com
From this perspective we see a potential sideways trend channel bounded by the gray-dashed lines. This channel can be traced back to early 2021. Consider what these two trends look like when one overlays the other.
THE S&P 500 TREND OVERLAY
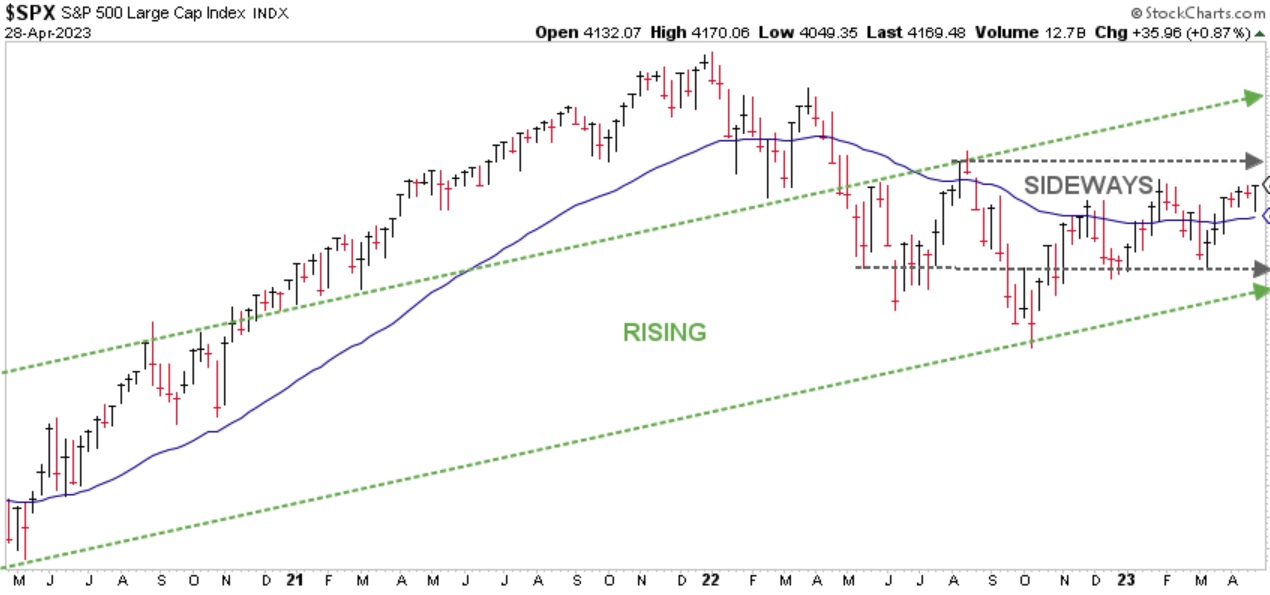
Chart courtesy of StockCharts.com
From this viewpoint, we observe the possibility of a sideways channel that currently exists within a rising channel. With this perspective, here’s what I believe we should expect over the months ahead, based on what the market may be suggesting right now.
- The S&P is still in a rising trend, so we should expect higher prices in the future. Historically speaking, we should eventually see new all-time highs.
- Prices need to rise above and remain above the top, gray-dashed line however, for us to see new highs sooner rather than later. Otherwise, any new highs may not materialize until sometime in 2024, or even 2025, if at all.
- There will likely be more headline news that causes concern to investors that will result in stock market price volatility. This may include more bank failures, continued fears of a recession in the US, etc. However, if prices remain either (1) above the Blue Line, and/or (2) above the bottom, green-dashed line, I don’t believe our clients should be overly concerned.
- Finally, based on historical patterns, I believe it is very unlikely the market will experience the dreaded “Trend Correction” found in Chapter 5 of my book, Protecting The Pig. While I believe the potential for such losses exists in the years ahead, the patterns at this time do not support a stock market “crash” or other similar outcome that some people may be promoting through the mainstream media.
Remember, the key is the Blue Line. If time permits, I will post some charts of some of the banking stocks that are suffering massive losses this year in the weeks ahead. The one thing they all have in common is their prices fell below and remained below their Blue Lines long before some of them experienced price crashes and outright failure.
THE “BLUE LINE”: A CLOSER LOOK
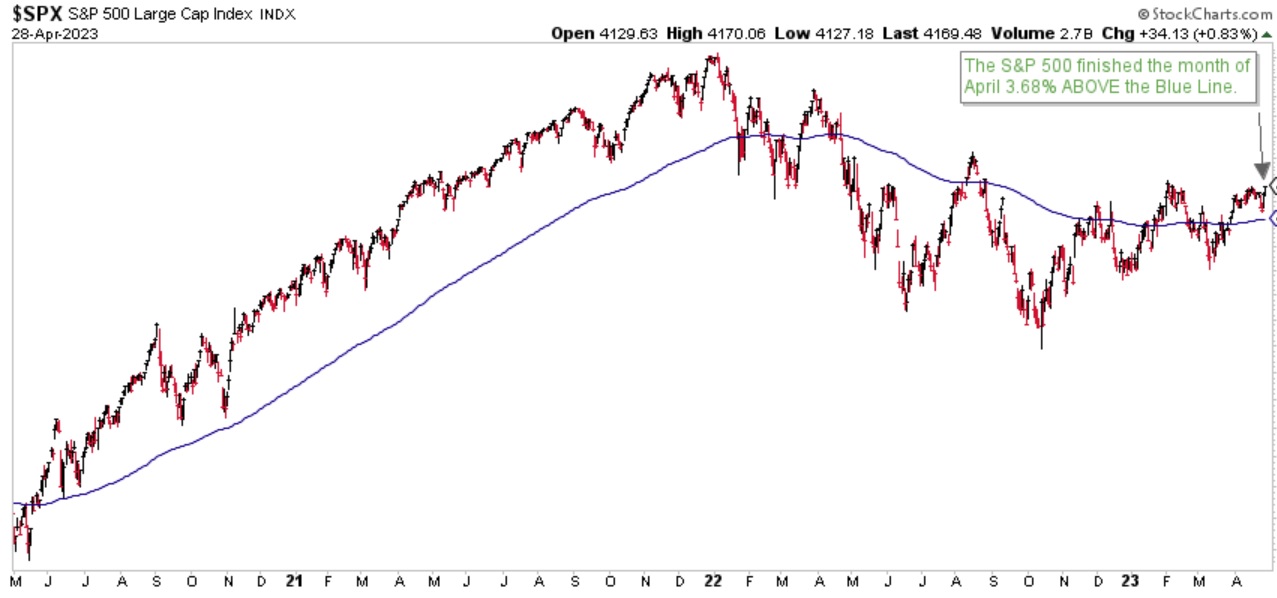
Chart courtesy of StockCharts.com
The S&P finished the month of April 3.68% above the Blue Line, compared to 2.73% above the Blue Line at the end of March. Thank you for reading this update and for your continued trust and confidence, and do not hesitate to call me with any questions at (833) 258-2583.
Jeff Link, Founder
Disclaimers:
The BLUE LINE INVESTING® (BLI) investment process was founded on over 95 years of stock market history. It seeks to identify and align investment decisions with multiyear trends. Various aspects of this process have been illustrated in my book Protecting The Pig: How Stock Market Trends Reveal the Way to Grow and Preserve Your Wealth.
The S&P 500 Index is one of the most commonly followed equity indices, and many consider it one of the best representations of the U.S. stock market, and a bellwether for the U.S. economy. It is comprised of 500 large companies having common stock listed on the NYSE or NASDAQ. The volatility (beta) of the account may be greater or less than the index. It is not possible to invest directly in this index.
Technical analysis is a method of evaluating securities by analyzing statistics generated by market activity, such as past prices and volumes. Technical analysis attempts to predict a future stock price or direction based on market trends. The assumption is that the market follows discernible patterns and if these patterns can be identified then a prediction can be made. The risk is that markets may not always follow patterns. There are certain limitations to technical analysis research, such as the calculation results being impacted by changes in security price during periods of market volatility. Technical analysis is one of many indicators that may be used to analyze market data for investing purposes and should not be considered a guaranteed prediction of market activity. The opinions expressed are those of BLI. The opinions referenced are as of the date of publication and are subject to change without notice. BLI reserves the right to modify its current investment strategies based on changing market dynamics or client needs.
Past performance is not indicative of future results. This material is not financial advice or an offer to sell any product. The information contained herein should not be considered a recommendation to purchase or sell any particular security. Forward looking statements cannot be guaranteed.
Guardian Wealth Advisors, LLC (“GWA”) is an investment adviser registered with the U.S. Securities and Exchange Commission. Registration does not imply a certain level of skill or training. More information about GWA’s investment advisory services can be found in its Form CRS or Form ADV Part 2, which is available upon request.
GWA-23-45

