
Which is more important for wining a Super Bowl–a great offense or defense?
On February 8th, 2026, that question was answered in decisive fashion when the Seattle Seahawks defeated the New England Patriots 29–13. In this article, I want to share something important from that outcome that I believe will be essential for investors–especially those over 50–to prosper financially in the years ahead.
When I asked ChatGPT to provide a one-hundred-word summary of what contributed to the outcome of the Super Bowl, its response began with:
“Seattle won by controlling risk and capitalizing on mistakes.”
If you watched the game, you saw how they controlled risk–through their defense. The Seahawks’ defensive coordinator designed a disciplined game plan, and the players executed it with precision.
Their defense suffocated the Patriots’ offense, holding them scoreless for three quarters. Meanwhile, the Seahawks were content to kick field goals, steadily putting points on the board rather than forcing unnecessary risks.
It wasn’t flashy. It was disciplined.
When it comes to financial success in the stock market, I believe this lesson is highly applicable.
Finding Order Within the Chaos
In a prior article, I illustrated a historical chart of the S&P 500 Index covering more than a century of price performance. (See below)
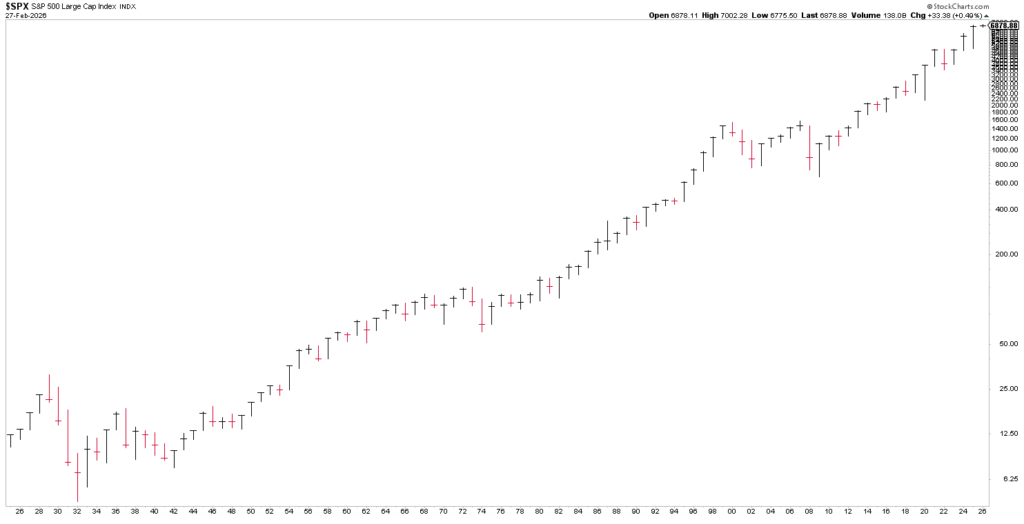
Chart courtesy of StockCharts.com, Data as of 2/28/26
At first glance, the chart can appear chaotic–just a long series of rises and declines. From that viewpoint alone, it isn’t especially helpful. But once we begin to identify the order hidden within the movement, our perspective changes. By drawing the upper and lower rising boundaries that have guided this long-term trend, we can better understand the market’s structure. Those boundaries help us think more clearly about how to control risk and capital on mistakes.
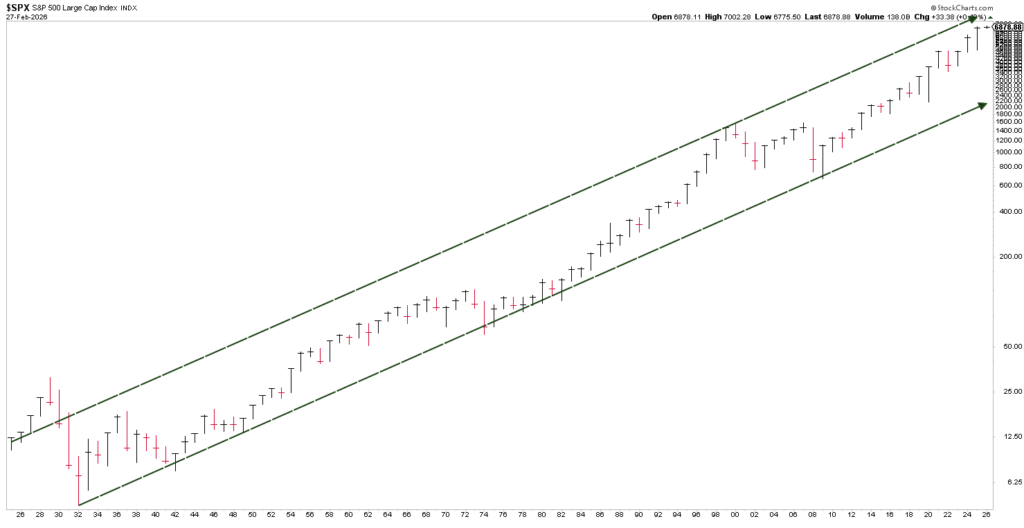
Chart courtesy of StockCharts.com, Data as of 2/28/26
As it pertains to “capitalizing on mistakes,” I often prefer to use Michael Jordan’s words:
“Take a negative and turn it into a positive.”
But to do that, we must first recognize what the negatives look like. Over the past hundred years, there have been five specific periods of MAJOR market declines within this long-term uptrend. I have circled those periods in red on the chart.
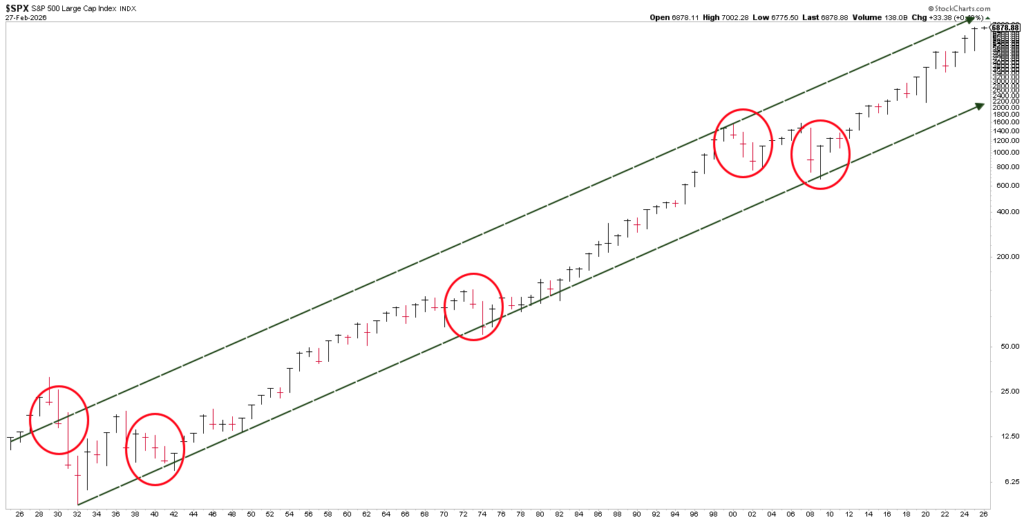
Chart courtesy of StockCharts.com, Data as of 2/28/26
In each of these five examples, the market declined anywhere from approximately 20% on the low end to almost 90% on the high end. What most people don’t realize is that all five followed the same behavioral pattern during their descent.
Why should that matter?
Because patterns repeat. And if patterns repeat, preparation becomes possible.
Where We Are in the Current Cycle
Calendar year 2025 marked the sixteenth year of this secular bull market (refer to the black circle in the upper right-hand corner of the chart).
Historically, secular bull markets have lasted approximately eighteen years before coming to an end. That does not mean this one must end on the same schedule. But like every secular market before it, it will eventually conclude.
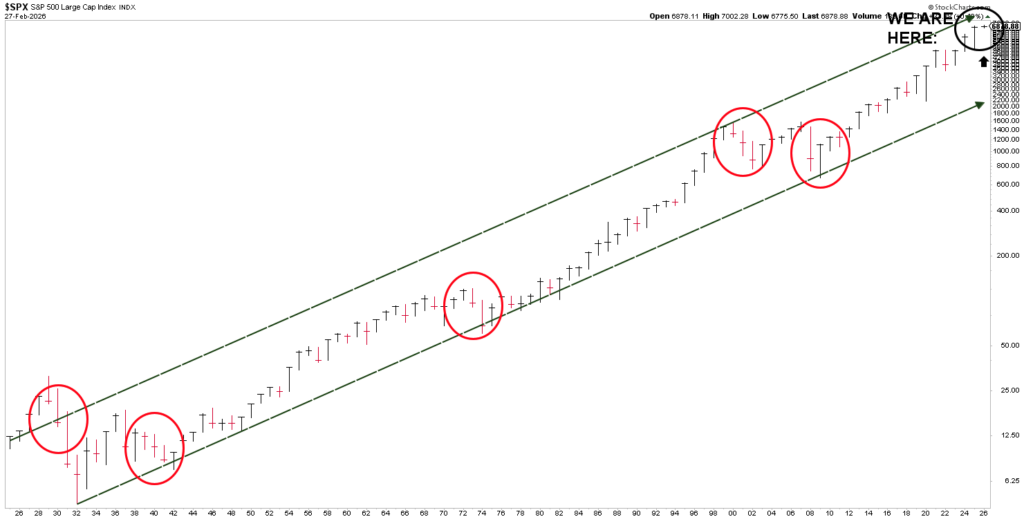
Chart courtesy of StockCharts.com, Data as of 2/28/26
Returning to the football analogy, the layering of information on these charts represents part of the foundation of the BLUE LINE INVESTING Strategy’s risk-management playbook. When this market ultimately reaches its top–whether that occurs soon or several years from now–I am confident the warning signs will be present for those who know what to look for.
People rarely experience financial trouble because of their investment gains. Trouble almost always comes from investment losses occurring at a stage of life when there is not enough time to recover. That reality is why this process remains hyper-focused on risk management.
Over the next five months, I plan to work through how each of these historical downturns followed the same behavioral pattern–and why that gives me confidence the next one will as well.
The BLUE LINE INVESTING Strategy has the playbook.
Execution is all that remains.
STOCK MARKET, WATCHING FOR THE TOP:
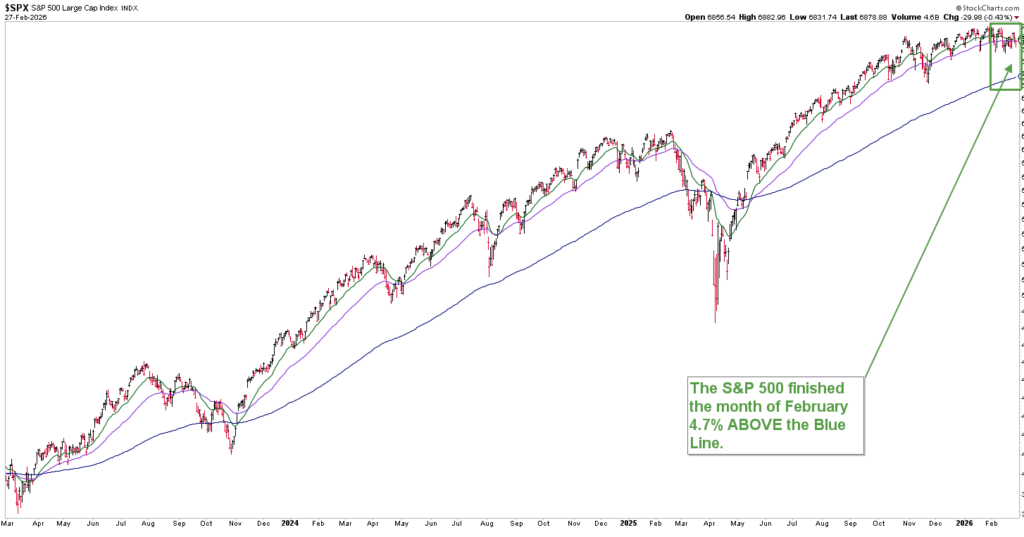
Chart courtesy of StockCharts.com, Data as of 2/28/26
The S&P finished the month of February 4.7% above the Blue Line, compared to 6.7% above the Blue Line at the end of January.
If you’re not a current client and would like to discover how the BLUE LINE INVESTING Strategy may help you reduce risk without limiting your potential upside gains, email info@bluelineinvesting.com with “Strategy” in the subject line. It could be one of the most valuable and profitable conversations you have this year.
Jeff Link
Founder
Disclaimers:
The BLUE LINE INVESTING® (BLI) investment process was founded on over 95 years of stock market history. It seeks to identify and align investment decisions with multiyear trends. Various aspects of this process have been illustrated in my book Protecting The Pig: How Stock Market Trends Reveal the Way to Grow and Preserve Your Wealth.
The S&P 500 Index is one of the most commonly followed equity indices, and many consider it one of the best representations of the U.S. stock market, and a bellwether for the U.S. economy. It is comprised of 500 large companies having common stock listed on the NYSE or NASDAQ. The volatility (beta) of the account may be greater or less than the index. It is not possible to invest directly in this index.
Technical analysis is a method of evaluating securities by analyzing statistics generated by market activity, such as past prices and volumes. Technical analysis attempts to predict a future stock price or direction based on market trends. The assumption is that the market follows discernible patterns and if these patterns can be identified then a prediction can be made. The risk is that markets may not always follow patterns. There are certain limitations to technical analysis research, such as the calculation results being impacted by changes in security price during periods of market volatility. Technical analysis is one of many indicators that may be used to analyze market data for investing purposes and should not be considered a guaranteed prediction of market activity. The opinions expressed are those of BLI. The opinions referenced are as of the date of publication and are subject to change without notice. BLI reserves the right to modify its current investment strategies based on changing market dynamics or client needs.
Past performance is not indicative of future results. This material is not financial advice or an offer to sell any product. The information contained herein should not be considered a recommendation to purchase or sell any particular security. Forward-looking statements cannot be guaranteed.
Investment advisory services offered through Guardian Wealth Advisors, LLC D/B/A Blue Line Investing. Guardian Wealth Advisors, LLC (“GWA”) is an investment adviser registered with the U.S. Securities and Exchange Commission. Registration does not imply a certain level of skill or training. More information about GWA’s investment advisory services can be found in its Form CRS or Form ADV Part 2, which is available upon request.
GWA-26-20

