
One of the greatest challenges for many investors is learning to not allow their emotions to impact their investment decisions. Last year was a perfect case study, and in my opinion, an example of what is likely to happen on a greater scale in the years ahead.
As calendar year 2021 was ending, few people expressed worry about the stock market, the bond market, the cryptocurrency market, or most “risk” markets for that matter. Most of the people I talked with wanted to “get in” because they were convinced the stock market would continue to rise and their emotions caused them to worry about missing out on future gains. Unfortunately, several people didn’t heed the warnings the stock market itself provided, choosing instead to take more risk at a time when they should have been doing exactly the opposite. Many chased what they believed would continue to be above-average gains, and instead, captured below-average losses.
The charts I show in these monthly updates are provided to help you learn how we can attempt to avoid these types of emotional investment decisions. In these charts I attempt to illustrate what type of trend channel the markets may be experiencing in the short-term as I illustrate in my book – Protecting The Pig. I believe proper recognition of these channels can help investors make decisions on when to buy into the market, add protective hedges when invested in the market, and exit the market during those rare times a true stock market top has formed. I believe these trends, when properly identified, can help an investor set realistic expectations so logic prevails with their investment decisions rather than their emotions.
Consider the following historical example of the S&P from the 1940’s.
THE 1946-1949 PRIMARY TREND: SIDEWAYS (Correcting)
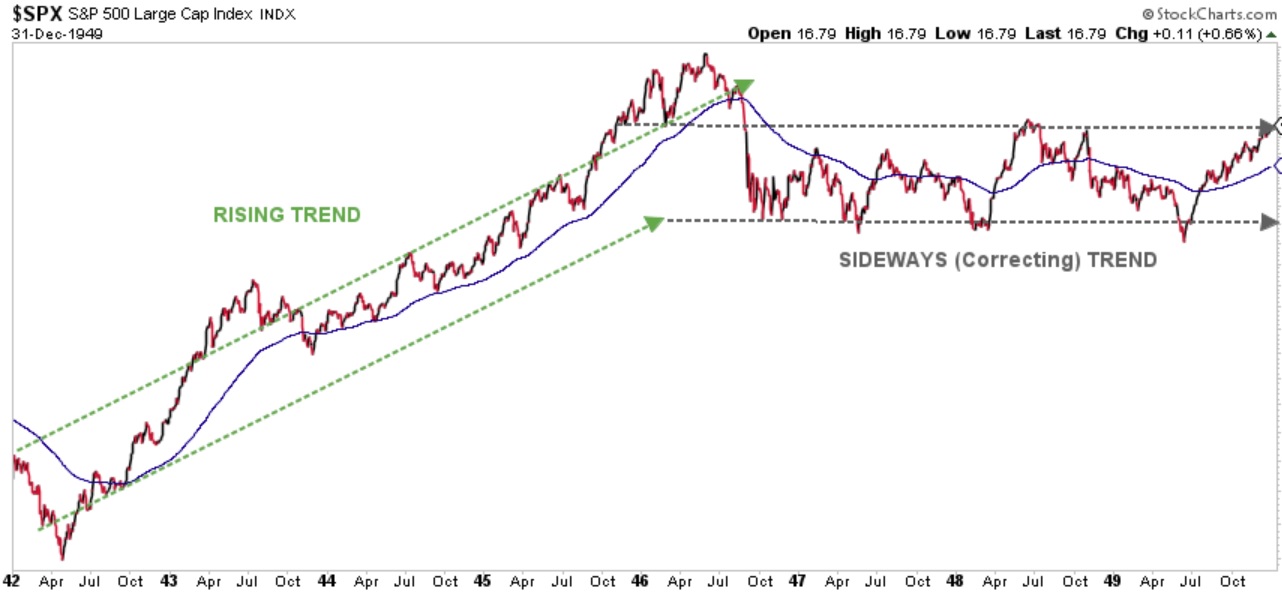
Chart courtesy of StockCharts.com
For four years the stock market enjoyed a rising trend. Then after a sharp price correction during 1946, the S&P continued to correct but in a sideways trend – not a declining trend. Being able to recognize this possibility can be helpful for every investor – especially how such a trend may impact where they are in their individual phase of life.
Now look at the chart below of the S&P for the past four-and-a-half years. Do you see the potential similarities?
THE 2022-??? PRIMARY TREND: SIDEWAYS (Correcting)
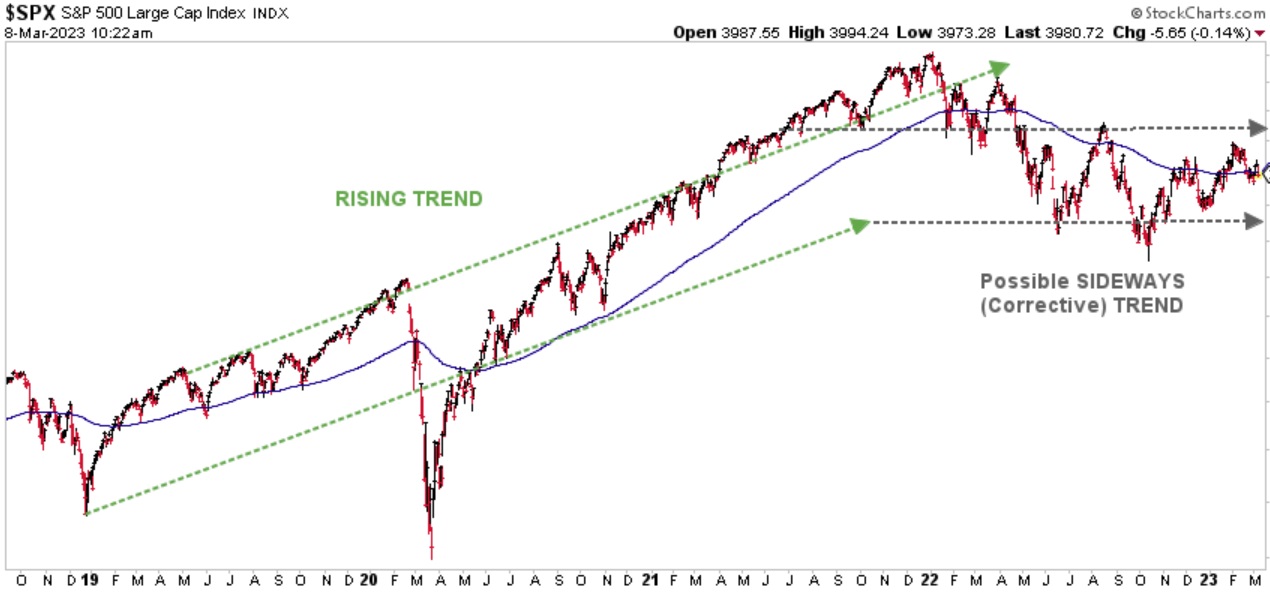
Chart courtesy of StockCharts.com
If a sideways trend plays out for the rest of 2023, maybe even into 2024, this expectation can help us – as profit seeking investors – to decide when to increase our investment risk, and when to reduce it, until a definitive rising trend is established once again. Regardless of where you are in your individual phase of life, and what age you are, the one factor that is common to every investor at every moment in time is the trend.
THE “BLUE LINE”: A CLOSER LOOK
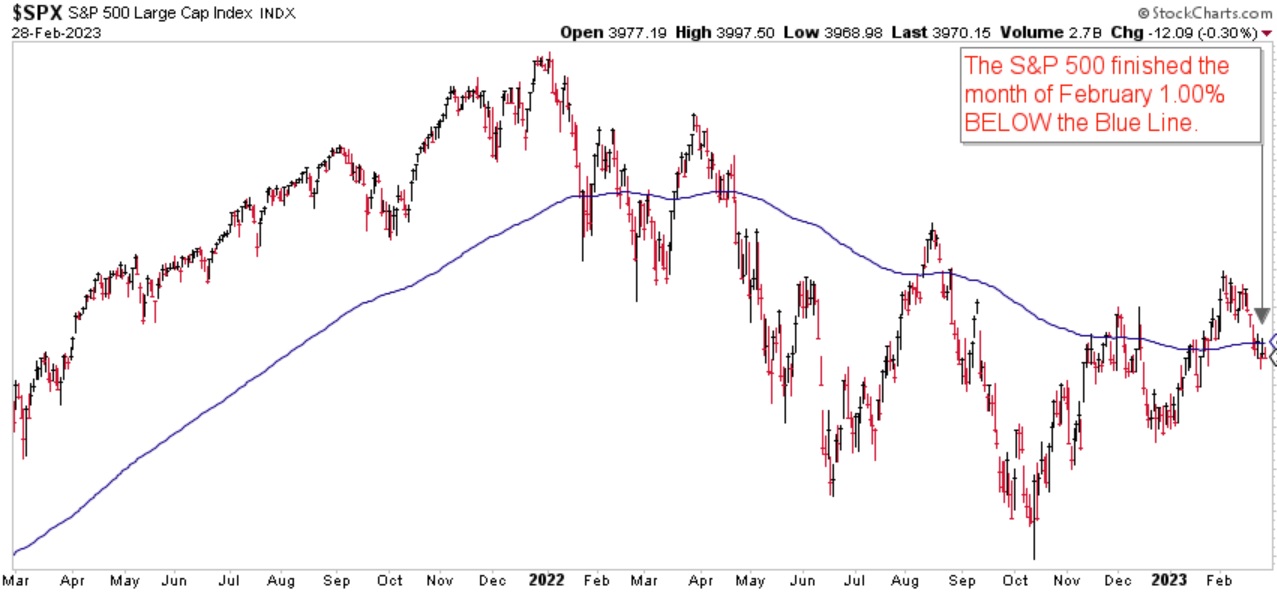
Chart courtesy of StockCharts.com
The S&P finished the month of February 1.00% below the Blue Line, compared to 2.00% above the Blue Line at the end of January.
Thank you for reading this update. If you are an existing client and know someone who may have recently retired or is within fifteen years or retirement that you believe could benefit from our investment process, please call me at (833) 258-2583.
Jeff Link
Disclaimers:
The BLUE LINE INVESTING® (BLI) investment process was founded on over 95 years of stock market history. It seeks to identify and align investment decisions with multiyear trends. Various aspects of this process have been illustrated in my book Protecting The Pig: How Stock Market Trends Reveal the Way to Grow and Preserve Your Wealth.
The S&P 500 Index is one of the most commonly followed equity indices, and many consider it one of the best representations of the U.S. stock market, and a bellwether for the U.S. economy. It is comprised of 500 large companies having common stock listed on the NYSE or NASDAQ. The volatility (beta) of the account may be greater or less than the index. It is not possible to invest directly in this index.
Technical analysis is a method of evaluating securities by analyzing statistics generated by market activity, such as past prices and volumes. Technical analysis attempts to predict a future stock price or direction based on market trends. The assumption is that the market follows discernible patterns and if these patterns can be identified then a prediction can be made. The risk is that markets may not always follow patterns. There are certain limitations to technical analysis research, such as the calculation results being impacted by changes in security price during periods of market volatility. Technical analysis is one of many indicators that may be used to analyze market data for investing purposes and should not be considered a guaranteed prediction of market activity. The opinions expressed are those of BLI. The opinions referenced are as of the date of publication and are subject to change without notice. BLI reserves the right to modify its current investment strategies based on changing market dynamics or client needs.
Past performance is not indicative of future results. This material is not financial advice or an offer to sell any product. The information contained herein should not be considered a recommendation to purchase or sell any particular security. Forward looking statements cannot be guaranteed.
Guardian Wealth Advisors, LLC (“GWA”) is an investment adviser registered with the U.S. Securities and Exchange Commission. Registration does not imply a certain level of skill or training. More information about GWA’s investment advisory services can be found in its Form CRS or Form ADV Part 2, which is available upon request.
GWA-23-24

