
Where exactly in the investment playbook does it say a long-term investor must always remain fully invested?
Last month, we looked at how the Seattle Seahawks defense outperformed the New England Patriots offense in Super Bowl XL. The Patriots scored an impressive 490 points that season–an average of 28.8 per game–yet still fell short when it mattered most.
That raises a fair question: Will your investment strategy hold up when it matters most?
In this five-part series, we’re going to examine the five worst stock market declines of the past century. The goal is simple: identify the one factor they all had in common. If we can recognize that factor in real time, we put ourselves in a position not just to endure downturns–but potentially avoid the worst of them.
As Michael Jordan put it: “Take a negative and turn it into a positive.”
Because in investing, the real measure of success isn’t how much you make when markets rise–it’s how much you keep when they fall.
Looking Back to See Forward
Let’s go back nearly 100 years to the market crash that preceded the Great Depression.
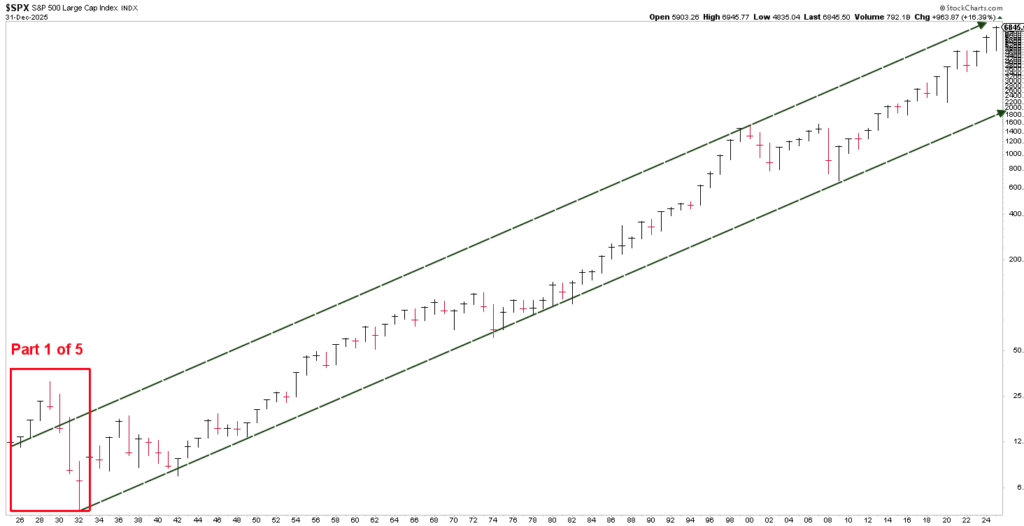
Chart courtesy of StockCharts.com, Data as of 12/31/25
This chart introduced previously shows a critical period–1925 through 1932. The first four years delivered strong gains. The next four didn’t just erase those gains–they compounded into devastating losses. From the 1929 peak to the 1932 low, the market fell by roughly 86%. Now, it’s unlikely we’ll see a decline of that exact magnitude again in your lifetime. But that’s not the point. Even a loss half that size can cause serious, lasting financial damage–especially if it occurs at the wrong time.
Here’s the advantage we have today: access to data. We can analyze, simplify, and visualize complex market behavior in ways that weren’t possible back then. The purpose of this series is to strip complexity down to something almost intuitive–something closer to color-by-numbers than guesswork.
A Shift in Perspective
Rather than studying the entire period broadly, let’s narrow our focus. We’re looking for one thing: the turning point–when strong positive momentum (1925-1928) began shifting into sustained decline (1929-1932). To find it, we need a different lens.
Enter the BLUE LINE–a concept introduced in Chapter 2 of Protecting The Pig. Instead of viewing price in isolation, we evaluate it relative to this line.
When you examine the chart of the rising years, the relationship is clear:
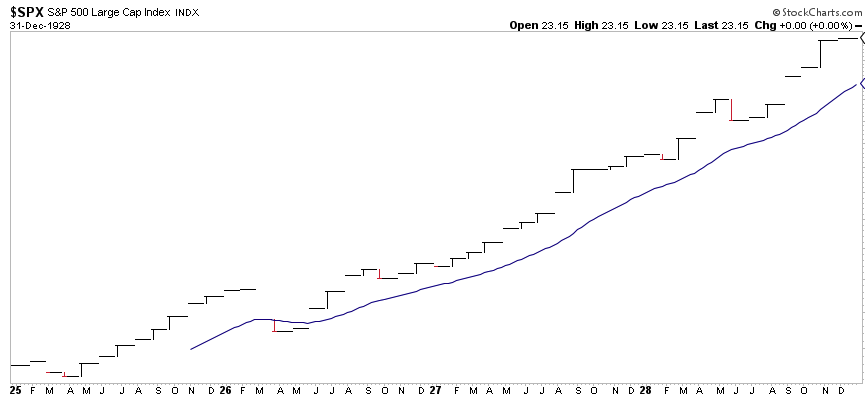
Chart courtesy of StockCharts.com, Data as of 12/31/1928
- As the market advanced, price consistently stayed above the BLUE LINE.
Now compare that to the decline:
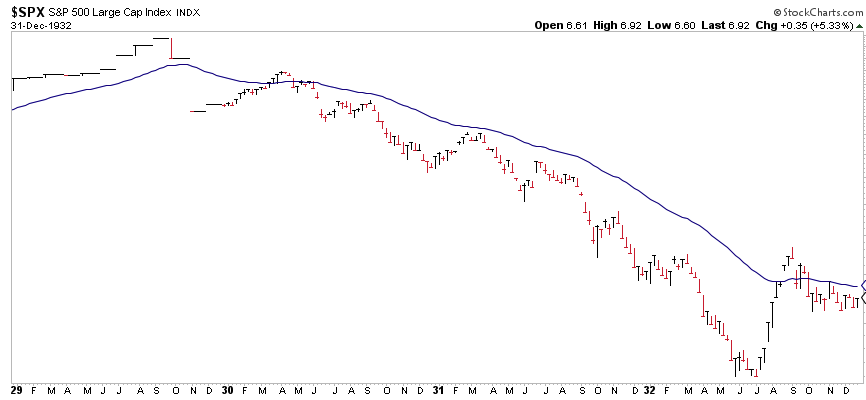
Chart courtesy of StockCharts.com, Data as of 12/31/1932
- As the market fell, price remained below the BLUE LINE.
When both periods are combined, the shift becomes obvious. The trend changed in late 1929–right when price dropped below the BLUE LINE and failed to recover above it.
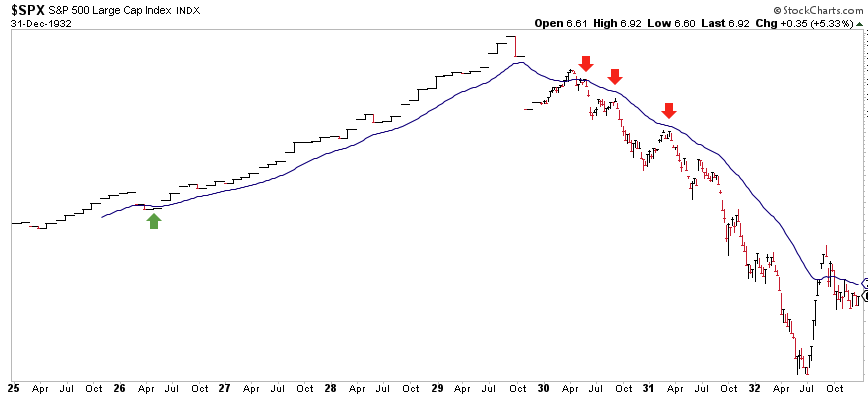
Chart courtesy of StockCharts.com, Data as of 12/31/1932
Notice what followed:
Repeated rallies attempted to reclaim the line…and failed (refer to the red arrows). Each failure led to lower lows.
This relationship–price relative to the BLUE LINE–cuts through much of the noise that typically confuses investors. It offers a simpler way to identify when risk is rising and when conditions are deteriorating. That’s not a small advantage. Done right, it can mean the difference between participating in growth and avoiding substantial loss.
Why This Matters
Market tops don’t announce themselves, but they do leave clues. Whether the next major peak comes soon or years from now, the signals will be there–for those who know what to look for. And here’s the uncomfortable truth: Most financial damage doesn’t come from poor gains, but rather from poorly timed losses. This is especially true for those who are older and later in life, when there isn’t enough time to recover.
That’s why this process stays anchored in risk management. Not out of fear–but out of discipline.
A Time and a Season
This article takes its title from Ecclesiastes 3:1-8–a passage that reminds us that everything has a season:
A time to keep…and a time to discard.
For now, I believe we are still in a season of keeping. But history is consistent on one point–that season will change. And when it does, recognizing that shift early matters. I believe the BLUE LINE INVESTING Strategy can play a meaningful role in helping identify when that season of transition begins.
Where We Stand Today
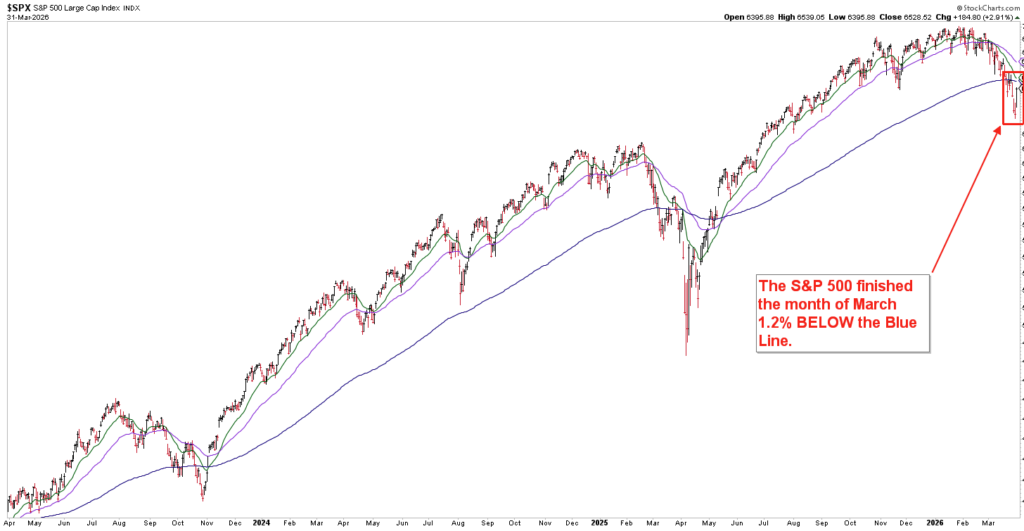 Chart courtesy of StockCharts.com, Data as of 3/31/26
As of the end of March:
- The S&P 500 finished the month 1.2% below the BLUE LINE
- Compared to 4.7% above it just one month prior
That doesn’t confirm a major shift–but it’s the type of movement worth paying attention to. Because the question isn’t whether markets will decline again. It’s whether investors will recognize the change before it becomes costly.
Jeff Link
Founder
Disclaimers:
The BLUE LINE INVESTING® (BLI) investment process was founded on over 95 years of stock market history. It seeks to identify and align investment decisions with multiyear trends. Various aspects of this process have been illustrated in my book Protecting The Pig: How Stock Market Trends Reveal the Way to Grow and Preserve Your Wealth.
The S&P 500 Index is one of the most commonly followed equity indices, and many consider it one of the best representations of the U.S. stock market, and a bellwether for the U.S. economy. It is comprised of 500 large companies having common stock listed on the NYSE or NASDAQ. The volatility (beta) of the account may be greater or less than the index. It is not possible to invest directly in this index.
Technical analysis is a method of evaluating securities by analyzing statistics generated by market activity, such as past prices and volumes. Technical analysis attempts to predict a future stock price or direction based on market trends. The assumption is that the market follows discernible patterns and if these patterns can be identified then a prediction can be made. The risk is that markets may not always follow patterns. There are certain limitations to technical analysis research, such as the calculation results being impacted by changes in security price during periods of market volatility. Technical analysis is one of many indicators that may be used to analyze market data for investing purposes and should not be considered a guaranteed prediction of market activity. The opinions expressed are those of BLI. The opinions referenced are as of the date of publication and are subject to change without notice. BLI reserves the right to modify its current investment strategies based on changing market dynamics or client needs.
Past performance is not indicative of future results. This material is not financial advice or an offer to sell any product. The information contained herein should not be considered a recommendation to purchase or sell any particular security. Forward-looking statements cannot be guaranteed.
Investment advisory services offered through Guardian Wealth Advisors, LLC D/B/A Blue Line Investing. Guardian Wealth Advisors, LLC (“GWA”) is an investment adviser registered with the U.S. Securities and Exchange Commission. Registration does not imply a certain level of skill or training. More information about GWA’s investment advisory services can be found in its Form CRS or Form ADV Part 2, which is available upon request.
GWA-26-28


