
Can biblical wisdom help you make better investment decisions? I believe it can. And in this article, I’m going to show you how–using Bitcoin as the example.
In last month’s article, Conventional Investment Wisdom Can Cost You…And Your Heirs, I talked about how following market trends–not age–can give investors a better shot at enjoying real “retirement pay raises.” I shared Daniel’s story as an example. By simply following the current upward trend in the stock market, his account has reached an all-time high – even after taking his annual Required Minimum Distributions (RMDs).
Of course, this naturally raises a fair question: “Sure, that approach worked while the market was climbing–but what happens when stocks start falling? Isn’t Daniel at risk of losing a lot if most of his portfolio is in stocks?
My answer? Not necessarily.
Before I explain why, let me share part of a verse from the Old Testament that sets the stage. The verse I’m referring to comes from Deuteronomy 19:15:
“At the mouth of two witnesses, or at the mouth of three witnesses shall the matter be made sure.”
In other words, truth and reliability are established through confirmation–through multiple, consistent indicators. Stock markets have a way of repeating themselves. Certain patterns show up repeatedly–and they’re worth paying attention to. In Chapter Six of my book, When Selling May be your Best Option, I talk about what I believe is the key to spotting when a market trend might be shifting.
As I explain on page 59, the first “witness” appears when an investment’s price drops below its Blue Line by a specified minimum percentage. The second “witness” shows up when the price tries to rally but only makes it back up to the underside of the Blue Line, failing to break meaningfully above it. When both signals occur, they often confirm that the trend is changing–even if only for the short term. And when that happens, the price typically heads lower afterward.
These are just two of the three witnesses I talk about in my book–but trust me, there are more. I highlight only a few here to show how the concept works. Now look at the five-year chart of Bitcoin below. I’ve circled this exact pattern from 2022. First, Bitcoin’s price fell below the Blue Line–potential witness #1. Then it rallied back up but only to the underside of the Blue Line–potential witness #2. After that, the price didn’t just drift lower…it plunged more than 50%.
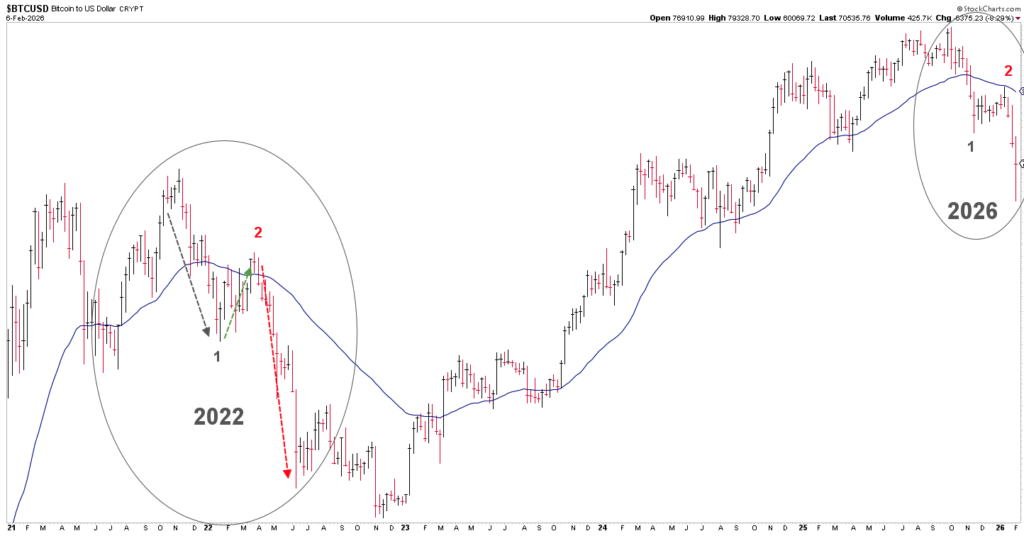
Chart courtesy of StockCharts.com, Data as of 2/6/26
To make the pattern easier to spot, I color-coded each step on the chart: a declining gray line for the first witness (#1), a rising, green-dashed line for the second witness (#2), and a red-dashed line to highlight the drop that followed.
What I want you to notice is that a very similar pattern has shown up again in recent months. In the upper-right corner of the chart (circled in gray), Bitcoin’s price dipped below the Blue Line in late 2025–potential witness #1–then staged a short rally right back to the underside of the Blue Line–potential witness #2. After that, it slid about 37% (so far).
The reason I’m pointing all this out is because these witnesses help us follow Warren Buffett’s two rules: Rule #1: Don’t lose money. Rule #2: Never forget Rule #1. And the best way to attempt to reduce–or even avoid–big losses is to spot the market’s historical warning signs before they turn into real damage. That becomes a whole lot easier when you know exactly what patterns to look for.
Since I opened this article with a Bible verse, I hope you won’t mind if I end with one as well.
“Can the blind lead the blind? Shall they not both fall into the ditch?
–Luke 6:39
Early in my career, I was taught–and genuinely believed–that any strategy involving market timing was foolish. So I repeated that belief to my clients because I thought it was true.
But research and experience has taught me otherwise. Looking back, when clients asked if it was possible to time the market and I automatically said “No,” I now realize I was doing exactly what scripture described–the blind leading the blind. And if I hadn’t challenged that old belief, I could eventually lead my clients right back into the ditch once this rising stock market trend comes to an end.
STOCK MARKET, WATCHING FOR THE TOP:
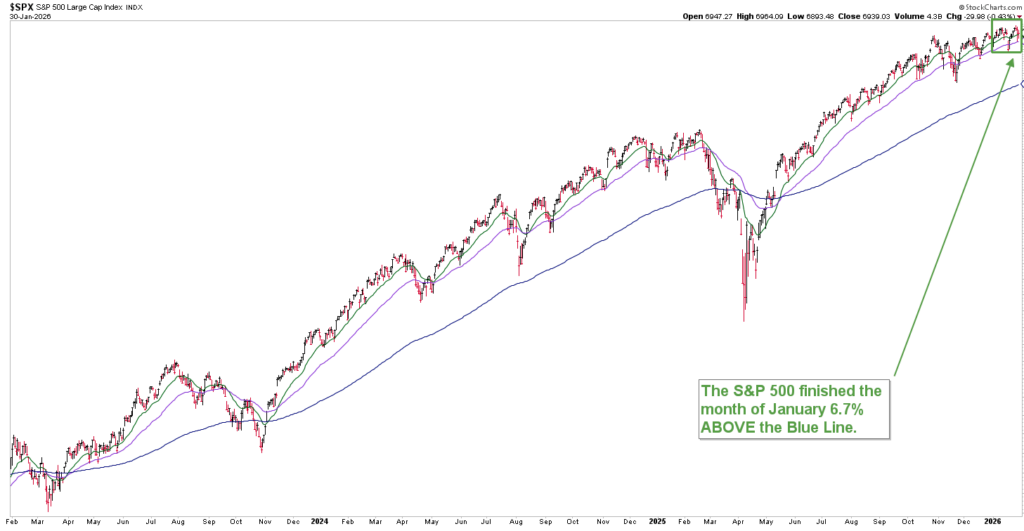
Chart courtesy of StockCharts.com, Data as of 1/31/26
The S&P finished the month of December 6.8% above the Blue Line, compared to 8.7% above the Blue Line at the end of November.
If you’re not a current client and would like to discover how the BLUE LINE INVESTING Strategy may help you reduce risk without limiting your potential upside gains, email info@bluelineinvesting.com with “Strategy” in the subject line. It could be one of the most valuable conversations you have this year.
Jeff Link
Founder
Disclaimers:
The BLUE LINE INVESTING® (BLI) investment process was founded on over 95 years of stock market history. It seeks to identify and align investment decisions with multiyear trends. Various aspects of this process have been illustrated in my book Protecting The Pig: How Stock Market Trends Reveal the Way to Grow and Preserve Your Wealth.
The S&P 500 Index is one of the most commonly followed equity indices, and many consider it one of the best representations of the U.S. stock market, and a bellwether for the U.S. economy. It is comprised of 500 large companies having common stock listed on the NYSE or NASDAQ. The volatility (beta) of the account may be greater or less than the index. It is not possible to invest directly in this index.
Technical analysis is a method of evaluating securities by analyzing statistics generated by market activity, such as past prices and volumes. Technical analysis attempts to predict a future stock price or direction based on market trends. The assumption is that the market follows discernible patterns and if these patterns can be identified then a prediction can be made. The risk is that markets may not always follow patterns. There are certain limitations to technical analysis research, such as the calculation results being impacted by changes in security price during periods of market volatility. Technical analysis is one of many indicators that may be used to analyze market data for investing purposes and should not be considered a guaranteed prediction of market activity. The opinions expressed are those of BLI. The opinions referenced are as of the date of publication and are subject to change without notice. BLI reserves the right to modify its current investment strategies based on changing market dynamics or client needs.
Past performance is not indicative of future results. This material is not financial advice or an offer to sell any product. The information contained herein should not be considered a recommendation to purchase or sell any particular security. Forward-looking statements cannot be guaranteed.
Investment advisory services offered through Guardian Wealth Advisors, LLC D/B/A Blue Line Investing. Guardian Wealth Advisors, LLC (“GWA”) is an investment adviser registered with the U.S. Securities and Exchange Commission. Registration does not imply a certain level of skill or training. More information about GWA’s investment advisory services can be found in its Form CRS or Form ADV Part 2, which is available upon request.
GWA-26-13

