
During November, the US stock markets experienced a continued price rally. As you can see in the chart below, the rally in the S&P 500 Index took on a similar pattern as it did back in the summer.
PRIMARY TREND: RISING (but correcting)
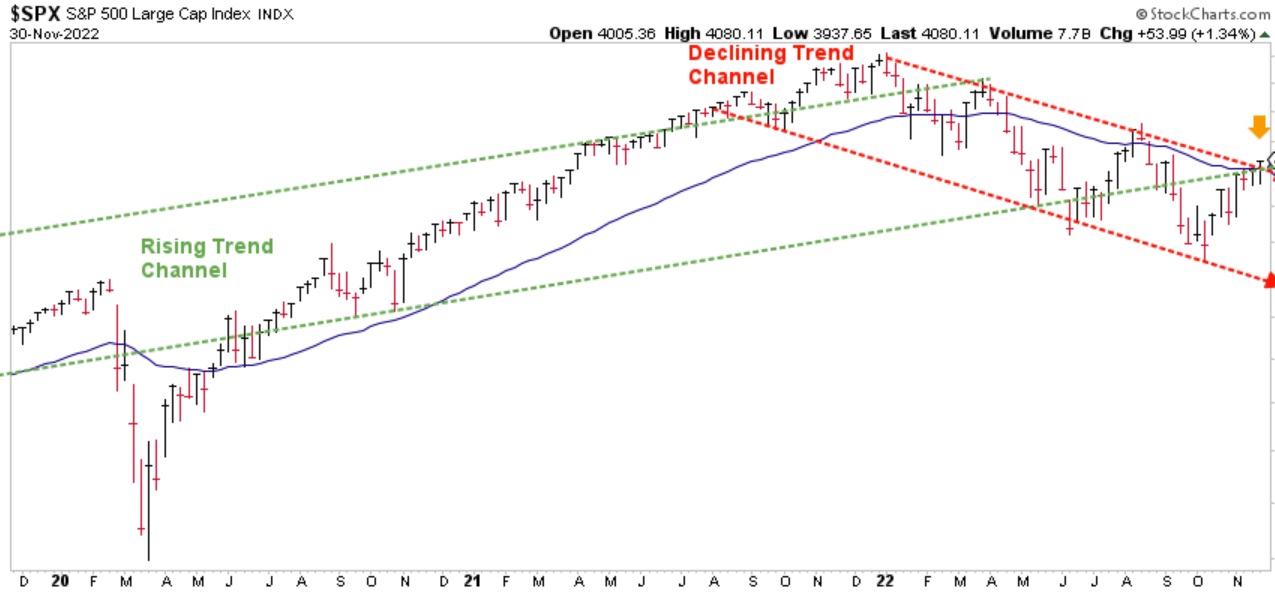
Chart courtesy of StockCharts.com
Beginning in June, the S&P touched the declining, red-dashed line. Then it rallied during July and into early August where it touched the higher declining, red-dashed line. Then it declined again from early August into October where it once again touched the lower, red-dashed line. Now, the rally that has taken place during October and November has once again touched the higher, red-dashed line once more (identified by the downward-pointing orange arrow). You can see that all the price rallies and declines have taken place within a very precise and confined declining trend channel. So, where does that leave the market now?
I find the current price point interesting. As of the end of the month, the S&P 500 has converged at: (1) its Blue Line; (2) the top of the declining trend channel; and (3) the bottom of the rising trend channel dating back into 2019. The market now faces a decision.
As I commented last month, all three major US stock market indices made new price lows in October. So, what I personally would find ideal would be for the markets to turn back down during the first half of 2023 with two indices going to new price lows and one refraining. If this were to happen, I believe that could provide a preferred buying point to “buy low” for those investors who “hedged high” at the beginning of 2022. We will have to continue to exercise patience to see what unfolds.
Even if the market continues higher from here, I am still monitoring several indicators that suggest continued caution. One of the risks of a further short-term rally is rising prices could draw more investors back into the market before turning down once again after the turn of the year.
THE “BLUE LINE”: A CLOSER LOOK
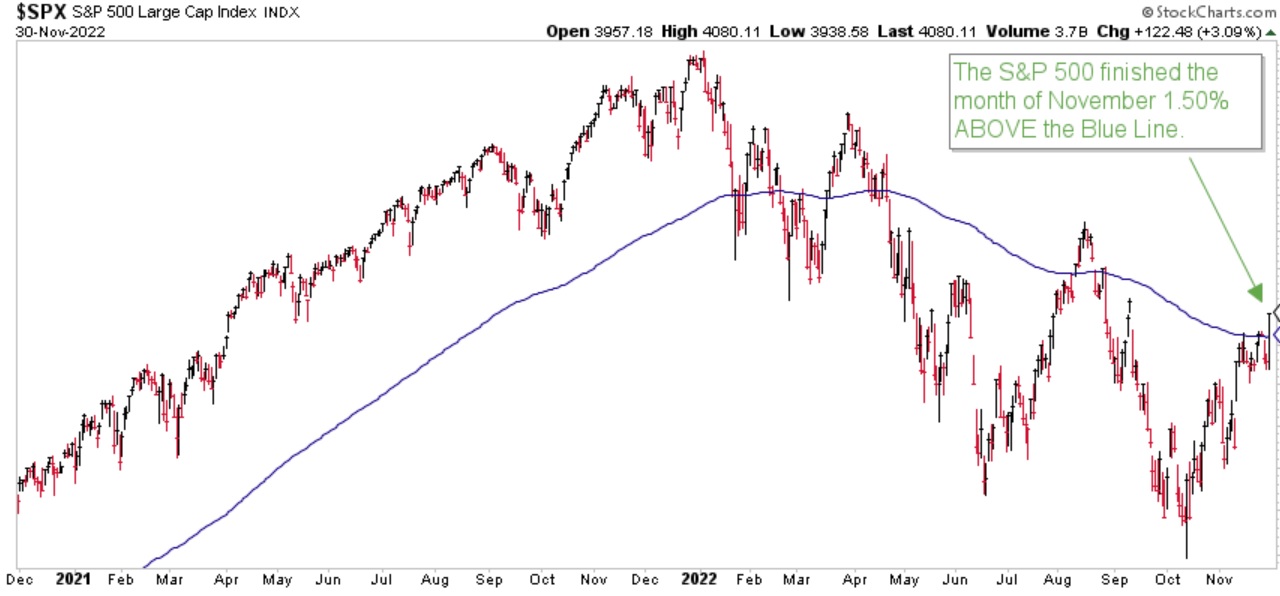
Chart courtesy of StockCharts.com
The S&P finished the month of November 1.50% above the Blue Line, compared to 4.28% below the Blue Line at the end of October. Price is now at the Blue Line, which, according to our process is encouraging, but by no means decisive.
Thank you for reading this update. If you are not one of our existing clients and would like to learn how our investment process may help you navigate the stock market roller coaster to help grow and preserve your wealth using trends, please call (833) 258-2583.
Jeff Link
Disclaimers:
The BLUE LINE INVESTING® (BLI) investment process was founded on over 95 years of stock market history. It seeks to identify and align investment decisions with multiyear trends. Various aspects of this process have been illustrated in my book Protecting The Pig: How Stock Market Trends Reveal the Way to Grow and Preserve Your Wealth.
The S&P 500 Index is one of the most commonly followed equity indices, and many consider it one of the best representations of the U.S. stock market, and a bellwether for the U.S. economy. It is comprised of 500 large companies having common stock listed on the NYSE or NASDAQ. The volatility (beta) of the account may be greater or less than the index. It is not possible to invest directly in this index.
Technical analysis is a method of evaluating securities by analyzing statistics generated by market activity, such as past prices and volumes. Technical analysis attempts to predict a future stock price or direction based on market trends. The assumption is that the market follows discernible patterns and if these patterns can be identified then a prediction can be made. The risk is that markets may not always follow patterns. There are certain limitations to technical analysis research, such as the calculation results being impacted by changes in security price during periods of market volatility. Technical analysis is one of many indicators that may be used to analyze market data for investing purposes and should not be considered a guaranteed prediction of market activity. The opinions expressed are those of BLI. The opinions referenced are as of the date of publication and are subject to change without notice. BLI reserves the right to modify its current investment strategies based on changing market dynamics or client needs.
Past performance is not indicative of future results. This material is not financial advice or an offer to sell any product. The information contained herein should not be considered a recommendation to purchase or sell any particular security. Forward looking statements cannot be guaranteed.
Guardian Wealth Advisors, LLC (“GWA”) is an investment adviser registered with the U.S. Securities and Exchange Commission. Registration does not imply a certain level of skill or training. More information about GWA’s investment advisory services can be found in its Form CRS or Form ADV Part 2, which is available upon request.
GWA-22-115

