
In last month’s update I said, The real purpose of this monthly update, as it was originally intended, is to provide readers with a snapshot of where I believe we are on the stock market ride at the end of any given month. The reason I post these updates is because eventually, somewhere in the future, the stock market will reach the summit of the mountain. If history repeats, as I expect it will, there should be a subsequent period where the stock markets retrace approximately 50% of the prior advance, and rather quickly.
As a case in point, the Japanese stock market began climbing the mountain in 1971 and reached the final summit in 1989. During that 18-year period, the index rose from approximately 2,000 to 39,000. However, once the summit was reached, the index dropped into a valley. Within just 3 years, the index plunged from 39,000 to approximately 15,000, for a whopping 61% loss.
I believe this is what the US stock markets are likely to mimic in the years ahead once they reach the mountain summit. And this is the reason why the BLUE LINE INVESTING® investment process exists. As Michael Jordan said:

“Take a negative and turn it into a positive.” Well said Michael, I agree wholeheartedly. So how do we take what could be a significant loss for most investors and attempt to turn it into a positive? I’ll touch on that in next month’s update.
STOCK MARKET, THE TREND:
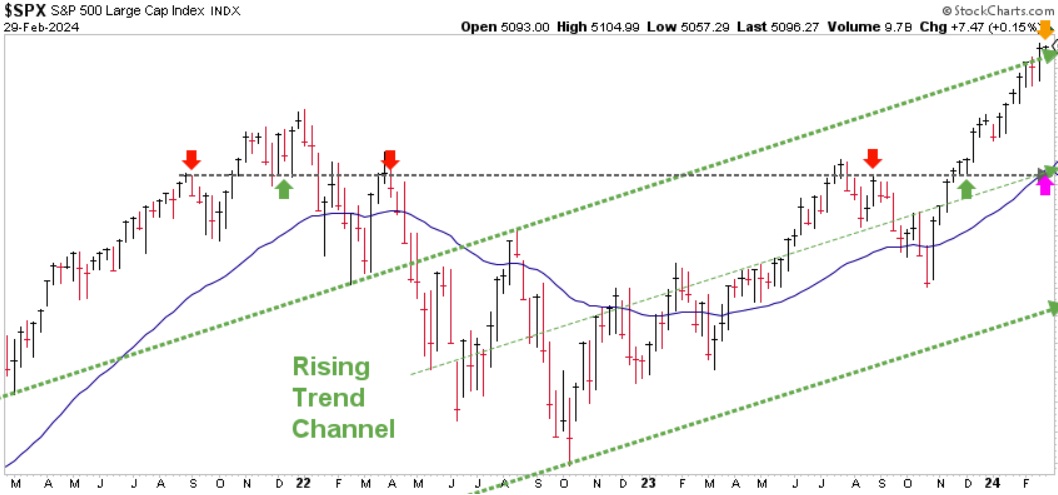
Chart courtesy of StockCharts.com
Based on what I am currently observing, I do not believe we are at the summit (at least not yet). However, like the end of calendar year 2021, I am temporarily cautious. The reason is that the price advance has reached the top, green-dashed line of the current rising trend channel (please note the orange arrow in the top right corner). This is where I would expect the market to at least pause. From a technical perspective, I believe it could be ideal for the market to experience a price correction of about 10%. This would take the market back to test the horizontal, gray-dashed line (please refer to the pink arrow). This price point just happens to coincide with three factors: (1) the Blue Line; (2) the middle of the rising trend; and (3) previous price support and resistance going back to 2021.
For clients with cash in their accounts, this is the main price area I would like to invest your money should a correction take place within the coming months.
STOCK MARKET, WATCHING FOR THE SUMMIT:
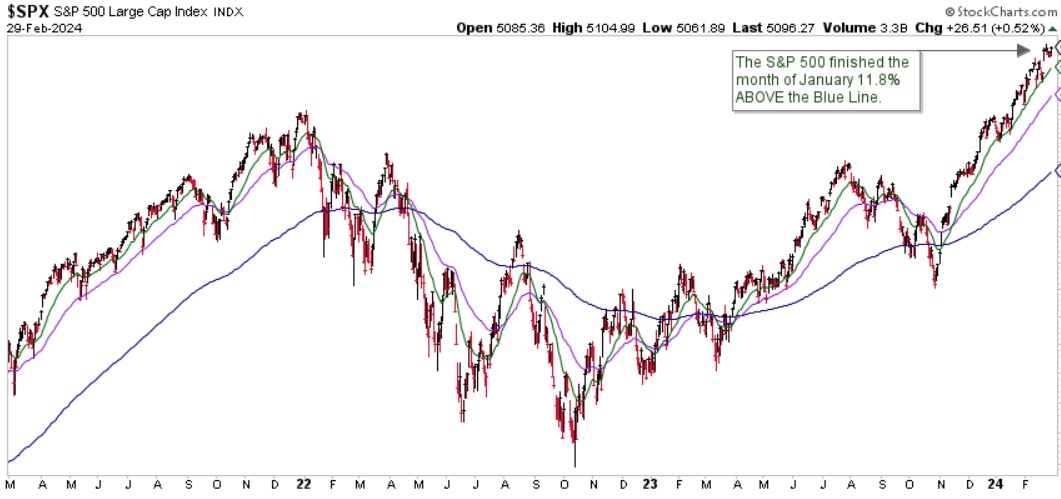
Chart courtesy of StockCharts.com
It is also important to note that the S&P finished the month of February 11.80% above the Blue Line, compared to being 8.75% above the Blue Line at the end of January. Historically, when price rises too quickly and exceeds the Blue Line by more than 10%, price corrections tend to follow thereafter. (Please refer to chapter 5 of my book, Protecting The Pig, for more information on price corrections).
One final observation is that the three primary U.S. stock indices referenced in last month’s update have achieved new highs. Historically, this suggests that the markets should continue higher, even if a price correction happens in the short term.
Jeff Link
Disclaimers:
The BLUE LINE INVESTING® (BLI) investment process was founded on over 95 years of stock market history. It seeks to identify and align investment decisions with multiyear trends. Various aspects of this process have been illustrated in my book Protecting The Pig: How Stock Market Trends Reveal the Way to Grow and Preserve Your Wealth.
The S&P 500 Index is one of the most commonly followed equity indices, and many consider it one of the best representations of the U.S. stock market, and a bellwether for the U.S. economy. It is comprised of 500 large companies having common stock listed on the NYSE or NASDAQ. The volatility (beta) of the account may be greater or less than the index. It is not possible to invest directly in this index.
Technical analysis is a method of evaluating securities by analyzing statistics generated by market activity, such as past prices and volumes. Technical analysis attempts to predict a future stock price or direction based on market trends. The assumption is that the market follows discernible patterns and if these patterns can be identified then a prediction can be made. The risk is that markets may not always follow patterns. There are certain limitations to technical analysis research, such as the calculation results being impacted by changes in security price during periods of market volatility. Technical analysis is one of many indicators that may be used to analyze market data for investing purposes and should not be considered a guaranteed prediction of market activity. The opinions expressed are those of BLI. The opinions referenced are as of the date of publication and are subject to change without notice. BLI reserves the right to modify its current investment strategies based on changing market dynamics or client needs.
Past performance is not indicative of future results. This material is not financial advice or an offer to sell any product. The information contained herein should not be considered a recommendation to purchase or sell any particular security. Forward-looking statements cannot be guaranteed.
Guardian Wealth Advisors, LLC (“GWA”) is an investment adviser registered with the U.S. Securities and Exchange Commission. Registration does not imply a certain level of skill or training. More information about GWA’s investment advisory services can be found in its Form CRS or Form ADV Part 2, which is available upon request.
GWA-24-19

