
Stock markets, like roller coasters, share some characteristics. For instance, the time during the rises typically far exceeds the time during the falls. Both experience high and low points throughout the ride. And regardless of whether they are rising or falling, they provoke an emotional reaction. Once again, I will use the following image for my comments that follow.

The U.S. stock market is currently enjoying a rising trend, and like the roller coaster, it continues its ascent towards a summit that lies somewhere in the future. But unlike the roller coaster, the stock market lacks an obvious viewpoint of when the summit is reached. As such, this can cause two common emotional decisions from investors.
The first is some investors begin transitioning their investments defensively far too early, leaving money on the table so to speak as the stock market ride continues higher. The second is some become overcome by greed and keep their investments too long, even buying more near the summit, then holding them during the market’s subsequent plunge.
The real purpose of this monthly update, as it was originally intended, is to provide readers with a snapshot of where I believe we are on the stock market ride at the end of any given month.
STOCK MARKET, THE TREND:
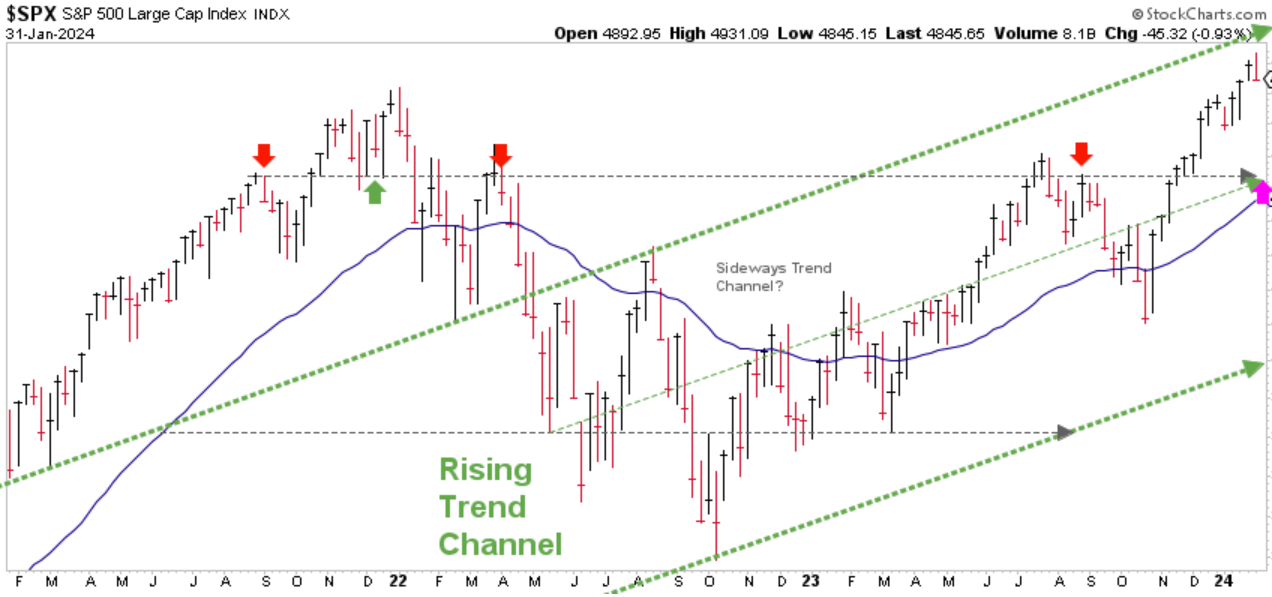
Chart courtesy of StockCharts.com
In the chart above, the rising, green-dashed lines represent the tracks of the roller coaster as it ascends toward the summit. The price of the S&P represents the cart on the tracks. And the BLUE LINE represents the primary indicator that helps identify the potential inflection point when the ride reaches the summit.
Based on what I am currently observing, I do not believe we are at the summit (at least not yet). However, like the end of calendar year 2021, there are a couple items that are causing me to be temporarily cautious.
The first is that the price advance from early November broke straight up and through the top, gray-dashed line. From a technical perspective, I would be really surprised if the S&P doesn’t retrace back to that line within the coming weeks or months. I have identified this spot with a pink arrow, which also happens to coincide with the Blue Line. This doesn’t have to happen, but I would be surprised if it doesn’t. If it does, it could prove to be an attractive area to add more money to stock investments, or at least, an S&P 500 Index type of investment.
STOCK MARKET, WATCHING FOR THE SUMMIT:
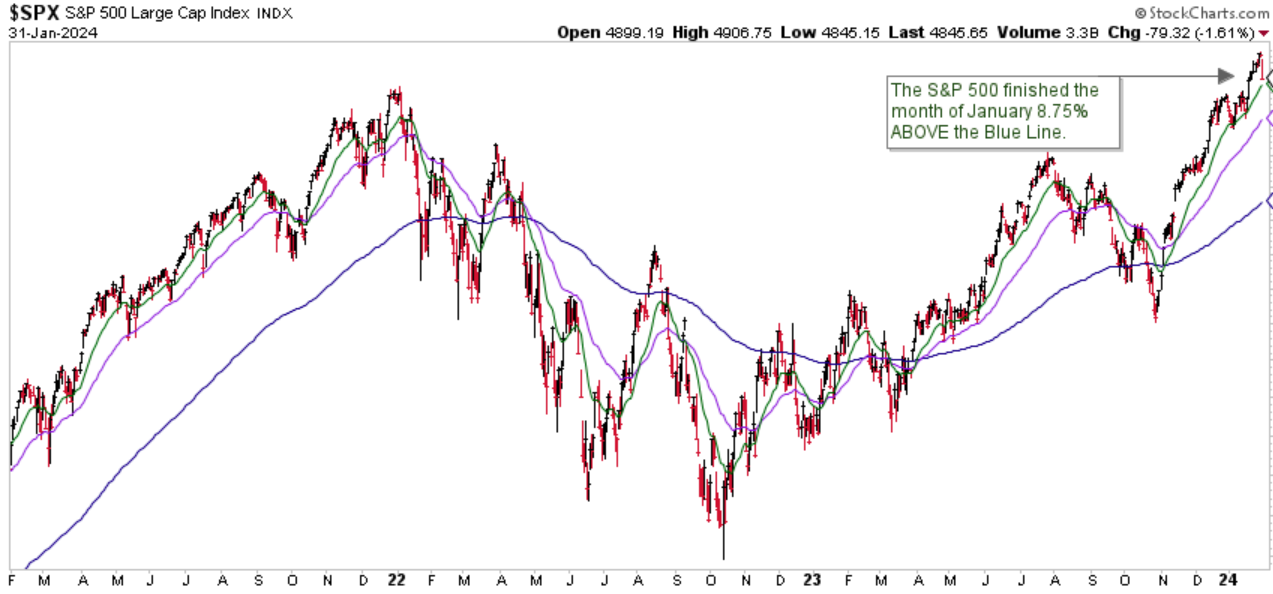
Chart courtesy of StockCharts.com
The second reason for my concern is the S&P finished the month of January 8.75% above the Blue Line, compared to being 9.06% above the Blue Line at the end of December. Historically, when price rises too quickly and exceeds the Blue Line by more than 10%, price corrections tend to follow thereafter. (Please refer to chapter 5 of my book, Protecting The Pig, for more information on price corrections).
One final observation is that of the three primary U.S. stock indices, only two of the three have exceeded their highs from the end of 2021. The Dow Jones Industrial Average and the S&P 500 have both exceeded their previous highs, while the NASDAQ Composite is currently lagging. This same pattern took place at the end of 2021 before the stock markets turned down.
I have recently acquired video editing software and if possible, intend on transitioning these updates to video sometime during this calendar year. I hope that will make it easier for readers to follow my comments and understand what I want to share. I’ll keep you posted.
Jeff Link, Founder and Author
Disclaimers:
The BLUE LINE INVESTING® (BLI) investment process was founded on over 95 years of stock market history. It seeks to identify and align investment decisions with multiyear trends. Various aspects of this process have been illustrated in my book Protecting The Pig: How Stock Market Trends Reveal the Way to Grow and Preserve Your Wealth.
The S&P 500 Index is one of the most commonly followed equity indices, and many consider it one of the best representations of the U.S. stock market, and a bellwether for the U.S. economy. It is comprised of 500 large companies having common stock listed on the NYSE or NASDAQ. The volatility (beta) of the account may be greater or less than the index. It is not possible to invest directly in this index.
Technical analysis is a method of evaluating securities by analyzing statistics generated by market activity, such as past prices and volumes. Technical analysis attempts to predict a future stock price or direction based on market trends. The assumption is that the market follows discernible patterns and if these patterns can be identified then a prediction can be made. The risk is that markets may not always follow patterns. There are certain limitations to technical analysis research, such as the calculation results being impacted by changes in security price during periods of market volatility. Technical analysis is one of many indicators that may be used to analyze market data for investing purposes and should not be considered a guaranteed prediction of market activity. The opinions expressed are those of BLI. The opinions referenced are as of the date of publication and are subject to change without notice. BLI reserves the right to modify its current investment strategies based on changing market dynamics or client needs.
Past performance is not indicative of future results. This material is not financial advice or an offer to sell any product. The information contained herein should not be considered a recommendation to purchase or sell any particular security. Forward-looking statements cannot be guaranteed.
Guardian Wealth Advisors, LLC (“GWA”) is an investment adviser registered with the U.S. Securities and Exchange Commission. Registration does not imply a certain level of skill or training. More information about GWA’s investment advisory services can be found in its Form CRS or Form ADV Part 2, which is available upon request.
GWA-24-08

