
In last month’s update I referenced what happened to the Japanese stock market from 1971 to 1989. To refresh your memory, it took approximately 18 years for the index to rise from 2,000 to 39,000, but only 3 years to plunge from 39,000 to approximately 15,000. In other words, many investors who bought into the later stages of the rising trend who expected to get continued above-average gains ended up getting the opposite: above-average losses.
The late Richard Russell, founder of Dow Theory Letters, used to write about this aspect of the financial markets. To paraphrase his words, he used to explain that when these long, secular bull markets come to an end, they tend to retrace approximately 1/3 to 2/3 of the preceding advance. In case someone believes the Japanese market was a unique and isolated historical event, let’s look at another example.
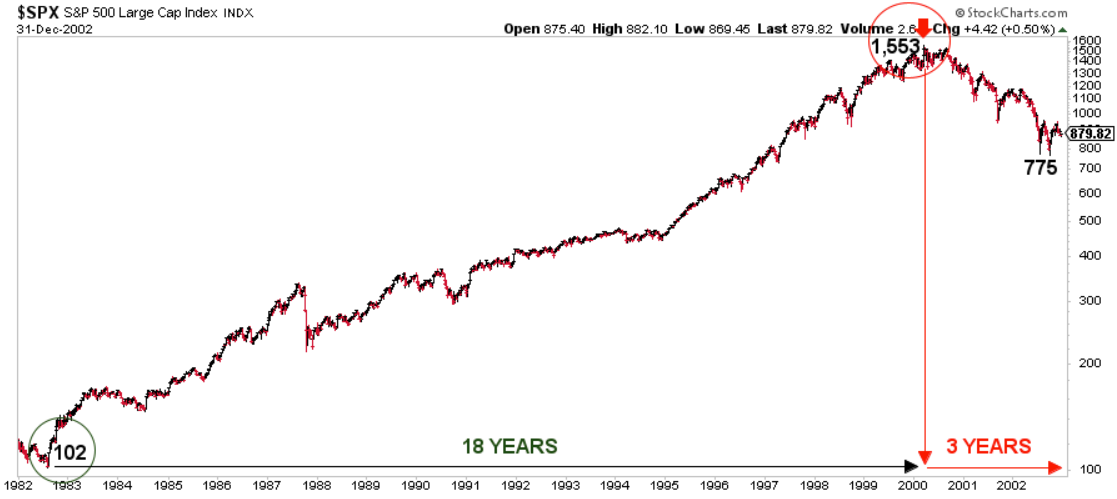
Chart courtesy of StockCharts.com
Like the Japanese stock market, the S&P 500 Index rose for approximately 18 years (August 1982 – March 2000) from a low of 102 to a high of 1,553 (i.e. a gain of 1,451 points). And like the Japanese stock market, it plunged over the subsequent 3 years to a low of 775. Richard was spot on with his analysis. Once the US stock market peaked, it subsequently retraced ½ of the preceding rise (the dead middle of 1/3 and 2/3). Coincidence? I don’t believe so. So, considering this information, where are we today?
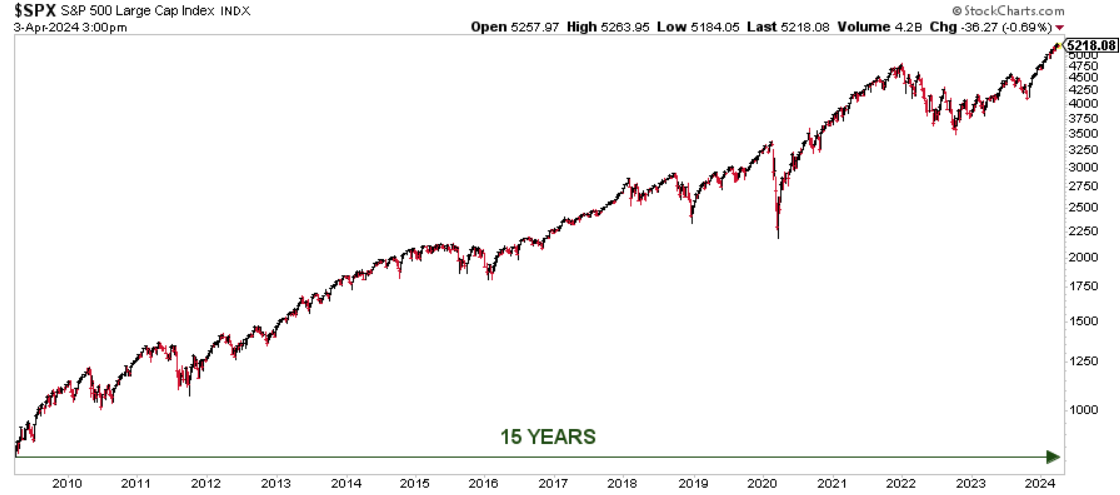
Chart courtesy of StockCharts.com
The S&P 500 Index is now 15 years into this rising trend that began from the price low in 2009. Historically speaking, more than 80% of the price advance may already be behind us. While I personally doubt this market will top in precisely 3 more years, I do believe it helps us be aware of what inning of the baseball game we may be in so we can preplan strategy changes in advance.
Now that I have provided you with the necessary historical perspective, I’ll share an investing secret in next month’s update using the movie TOP GUN: MAVERICK for illustration.
STOCK MARKET, THE TREND:
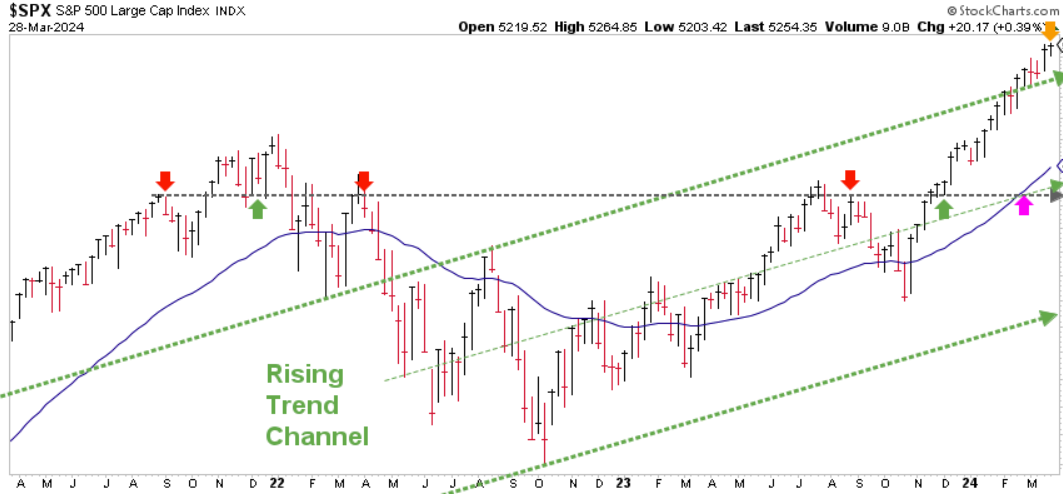
Chart courtesy of StockCharts.com
This chart of the stock market trend as viewed by the BLI investment process has been updated from last month. Price has broken out above the top, green-dashed line, and the next test will be to see if it can hold that line on a pullback. If it can’t, a price correction of between 7-10% seems possible.
STOCK MARKET, WATCHING FOR THE SUMMIT:
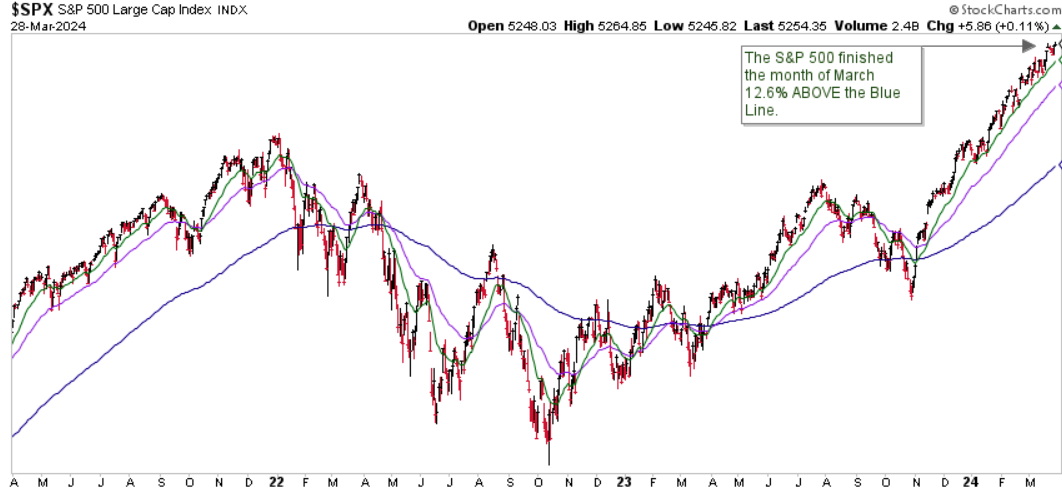
Chart courtesy of StockCharts.com
The S&P finished the month of March 12.60% above the Blue Line, compared to being 11.80% above the Blue Line at the end of February. Historically, when price rises too quickly and exceeds the Blue Line by more than 10%, price corrections tend to follow thereafter. (Please refer to chapter 5 of my book, Protecting The Pig, for more information on price corrections).
If you know someone who is 50-65 years old, has investable assets in the $500,000-$5,000,000 range, and is seeking the opportunity to both grow and preserve their wealth over the years ahead, please let me know. I currently have the capacity to work with a few new clients.
Thank you for your continued trust and support.
Jeff Link
Disclaimers:
The BLUE LINE INVESTING® (BLI) investment process was founded on over 95 years of stock market history. It seeks to identify and align investment decisions with multiyear trends. Various aspects of this process have been illustrated in my book Protecting The Pig: How Stock Market Trends Reveal the Way to Grow and Preserve Your Wealth.
The S&P 500 Index is one of the most commonly followed equity indices, and many consider it one of the best representations of the U.S. stock market, and a bellwether for the U.S. economy. It is comprised of 500 large companies having common stock listed on the NYSE or NASDAQ. The volatility (beta) of the account may be greater or less than the index. It is not possible to invest directly in this index.
Technical analysis is a method of evaluating securities by analyzing statistics generated by market activity, such as past prices and volumes. Technical analysis attempts to predict a future stock price or direction based on market trends. The assumption is that the market follows discernible patterns and if these patterns can be identified then a prediction can be made. The risk is that markets may not always follow patterns. There are certain limitations to technical analysis research, such as the calculation results being impacted by changes in security price during periods of market volatility. Technical analysis is one of many indicators that may be used to analyze market data for investing purposes and should not be considered a guaranteed prediction of market activity. The opinions expressed are those of BLI. The opinions referenced are as of the date of publication and are subject to change without notice. BLI reserves the right to modify its current investment strategies based on changing market dynamics or client needs.
Past performance is not indicative of future results. This material is not financial advice or an offer to sell any product. The information contained herein should not be considered a recommendation to purchase or sell any particular security. Forward-looking statements cannot be guaranteed.
Guardian Wealth Advisors, LLC (“GWA”) is an investment adviser registered with the U.S. Securities and Exchange Commission. Registration does not imply a certain level of skill or training. More information about GWA’s investment advisory services can be found in its Form CRS or Form ADV Part 2, which is available upon request.
GWA-24-22

