
Hurricane Ian made landfall in Florida in recent weeks as a Category 4 storm, killing over 100 people and causing over $50 billion in anticipated financial losses. If I could identify one positive takeaway from this natural disaster it would be that the loss of life was limited considering the number of people in the path of the storm. And the primary reason for this was due to early warning systems that monitor the development and potential path of storms to provide people with advance warning.
In a similar way, I believe the BLUE LINE INVESTING® investment process has helped investors significantly limit their investment losses this year compared to the major stock market indices, most of which have tended to be up to three times larger (or even worse for some investors).
While talking with my parents in recent days they shared that one of my relatives who is in her 70’s has lost 30% of her investment account value this year. I share this because some investors are complacent with losses, believing they are unavoidable, and oftentimes saying, “It always comes back.” And while that statement may be true over the long-term, for people like my relative, will she be able to survive financially over the coming years while waiting for it to come back? What if her story was your story instead?
PRIMARY TREND: RISING (but correcting)
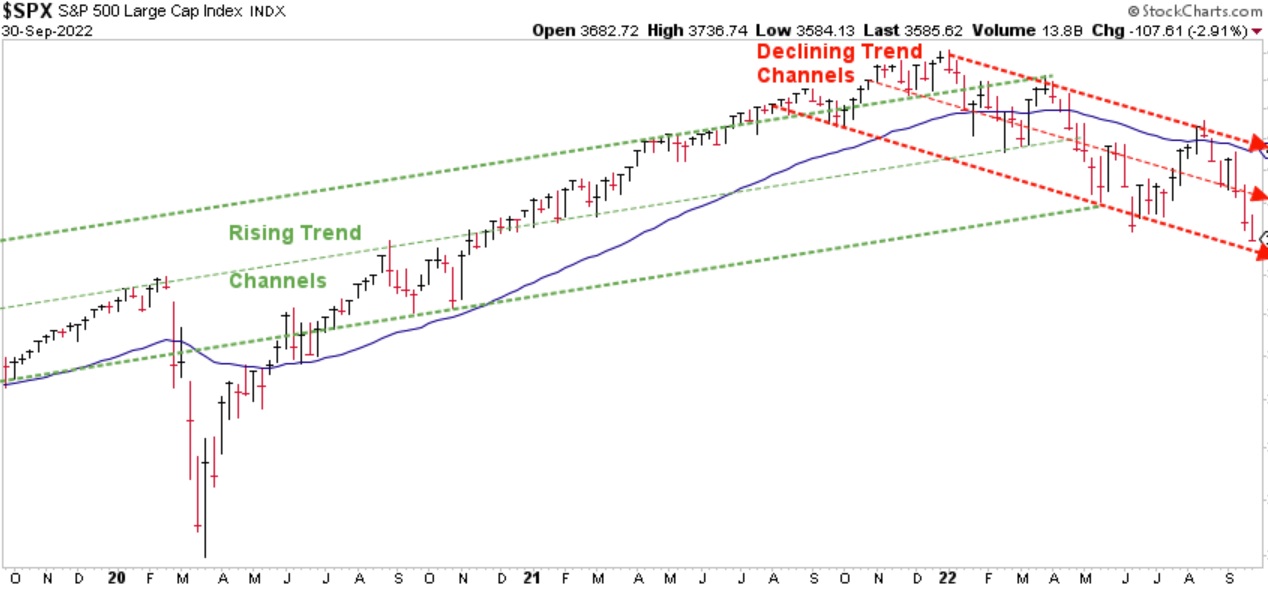
Chart courtesy of StockCharts.com
The chart above has been updated through the end of September and shows that so far, the channel correction that I referenced as a possibility back in a Special Report of January of this year appears to be continuing to unfold. In that report I expanded on the comments I made in my blog post ending December 2021 where I said:
“There’s an old saying, “You can’t find what you’re not looking for.” With US stock markets at all-time highs, some investors are throwing caution to the wind and buying into the stock market expecting continued above-average returns. And while it is certainly possible for prices to continue to rise, I believe the probability for a channel correction is high if you know what to look for. Historically, these types of corrections can result in stock market drops between 20 to 35%, typically taking place within twelve months.”
Through September, the investment losses for three major US stock market indices have fallen within this range. Even now, I do not believe the stock market has provided evidence that the bottom of this decline has taken place yet.
Like technology that monitors the weather and warns of potential hurricane development and path before the storm hits, there are investment strategies that can help investors in a similar way by limiting investment losses. I believe BLUE LINE INVESTING® is one such investment strategy and the concept of attempting to limit losses was the foundation upon which it was designed.
THE “BLUE LINE”: A CLOSER LOOK
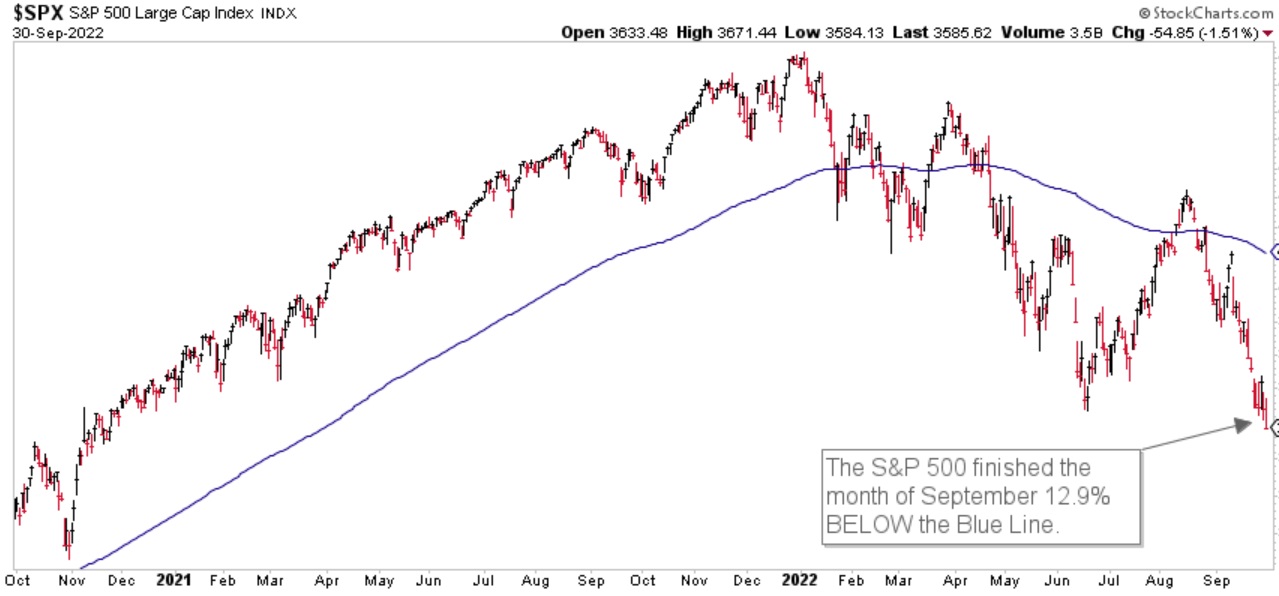
Chart courtesy of StockCharts.com
Returning to the S&P, it finished the month of September 12.90% below the Blue Line, compared to 5.40% below the Blue Line at the end of August. Price continues to remain below the Blue Line, which, according to our process suggests a defensive investment posture.
Thank you for reading this update. If you are not one of our existing clients and would like to learn how our investment process may help you navigate the stock market roller coaster using trends to help grow and preserve your wealth, please call (833) 258-2583.
Jeff Link
Disclaimers:
The BLUE LINE INVESTING® (BLI) investment process was founded on over 95 years of stock market history. It seeks to identify and align investment decisions with multiyear trends. Various aspects of this process have been illustrated in my book Protecting The Pig: How Stock Market Trends Reveal the Way to Grow and Preserve Your Wealth.
The S&P 500 Index is one of the most commonly followed equity indices, and many consider it one of the best representations of the U.S. stock market, and a bellwether for the U.S. economy. It is comprised of 500 large companies having common stock listed on the NYSE or NASDAQ. The volatility (beta) of the account may be greater or less than the index. It is not possible to invest directly in this index.
Technical analysis is a method of evaluating securities by analyzing statistics generated by market activity, such as past prices and volumes. Technical analysis attempts to predict a future stock price or direction based on market trends. The assumption is that the market follows discernible patterns and if these patterns can be identified then a prediction can be made. The risk is that markets may not always follow patterns. There are certain limitations to technical analysis research, such as the calculation results being impacted by changes in security price during periods of market volatility. Technical analysis is one of many indicators that may be used to analyze market data for investing purposes and should not be considered a guaranteed prediction of market activity. The opinions expressed are those of BLI. The opinions referenced are as of the date of publication and are subject to change without notice. BLI reserves the right to modify its current investment strategies based on changing market dynamics or client needs.
Past performance is not indicative of future results. This material is not financial advice or an offer to sell any product. The information contained herein should not be considered a recommendation to purchase or sell any particular security. Forward looking statements cannot be guaranteed.
Guardian Wealth Advisors, LLC (“GWA”) is an investment adviser registered with the U.S. Securities and Exchange Commission. Registration does not imply a certain level of skill or training. More information about GWA’s investment advisory services can be found in its Form CRS or Form ADV Part 2, which is available upon request.
GWA-22-94

