
After a brief, three-month reaction rally, the S&P 500 Index (and much of the rest of the US stock market) may be on the verge of continuing their channel corrections. This should not come as a surprise if you regularly read these updates. I have been talking about this for almost a year now and have been showing the patterns in the charts.
Speaking of charts, the one below from last month has been updated through the end of August. You will notice the temporary “low” in June just happened to coincide with the bottom of the declining trend channel and the August temporary “high” coincided with the top of the declining trend channel.
PRIMARY TREND: RISING (but correcting)
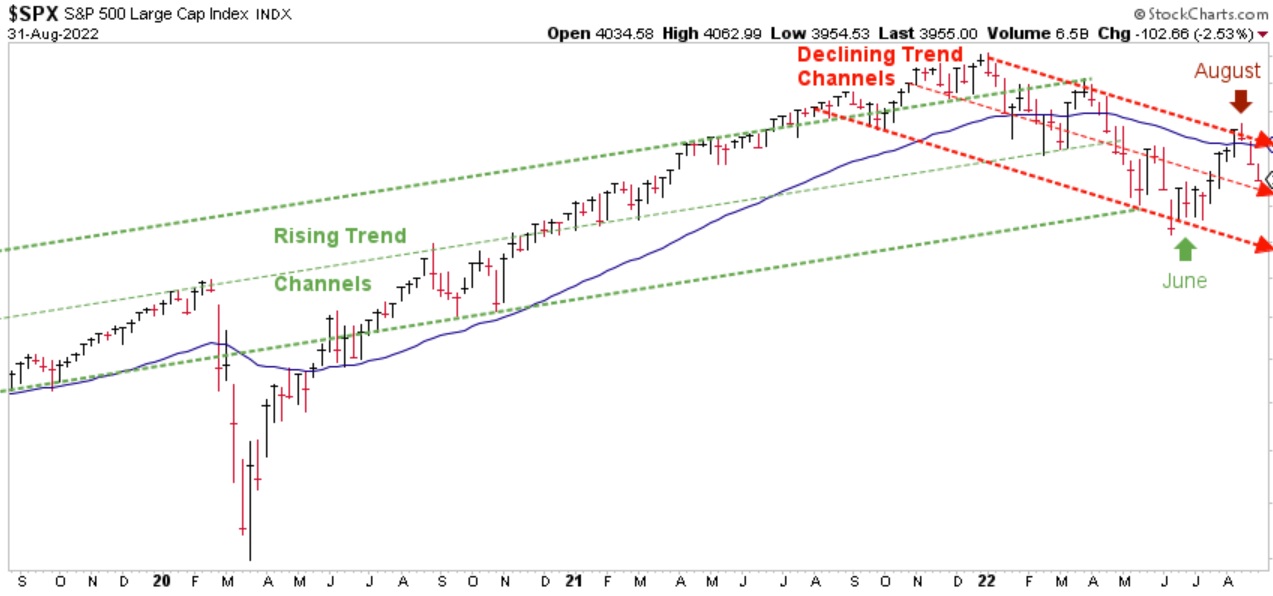
Chart courtesy of StockCharts.com
Wouldn’t you agree that this isn’t rocket science? Last month I said, “Price continues to remain under the Blue Line, and the “gap,” or space between the Blue Line and Purple Line is significant…In 1969 (as one example), the price rally in October stalled around the Blue Line with the Purple Line below. The eventual outcome was a continued price decline. In other words, applying these same patterns to today’s market does not negate the potential for new price lows somewhere ahead – at least not yet.”
Please refer to the area in the chart below within the red box. So far, the “gap” referenced last month proved trustworthy to help avoid buying into the summer counter-trend rally.
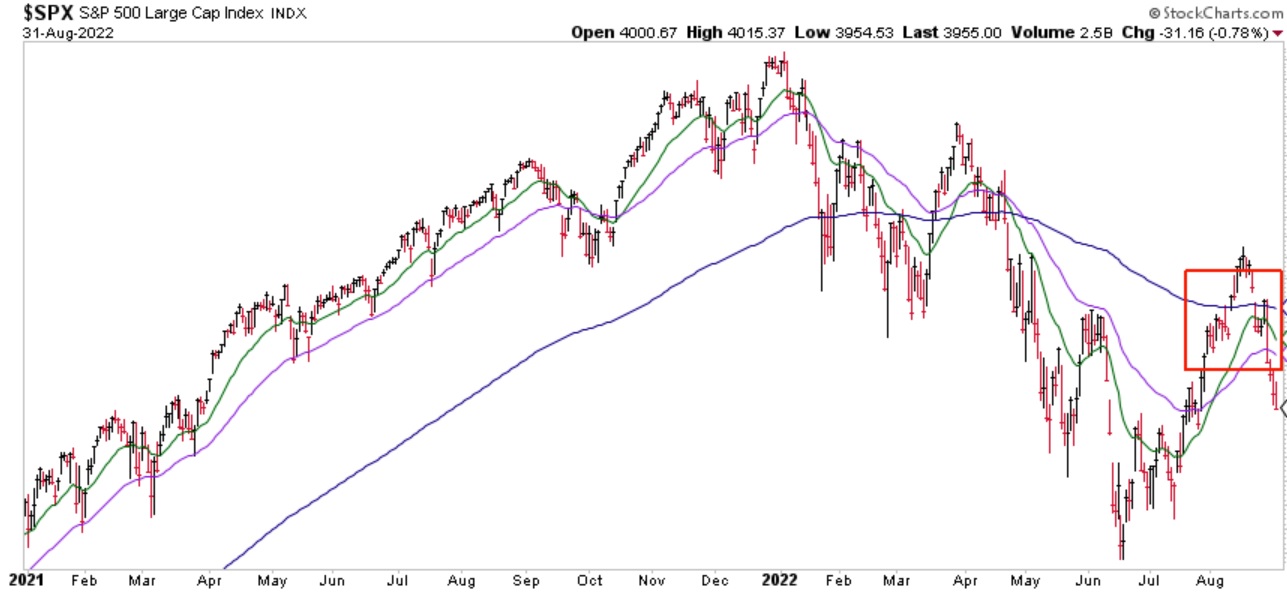
Chart courtesy of StockCharts.com
I believe it is best to continue remaining cautious and hedged for the time being, while waiting and hoping for 27,400 in the Dow Jones Industrial Average (Dow) sometime in the months ahead. What I am about to say is not a prediction – rather, as I stated, a hope. Remember – the name of this game is “Buy Low, Sell (or Hedge) High.”
Corrections come in different shapes and sizes. So far, the channel correction I wrote about in my Special Report way back in January of this year has similarly played out to that effect. However, another possibility I am monitoring right now can be seen in the Dow below. I find it interesting that the first wave down (labeled Wave A) from January into June was almost exactly 20%. Then, the counter-trend rally (labeled Wave B) was almost exactly 15%. (Notice these are very round and precise numbers). So, if we have begun the third and final corrective wave (Wave C) I would expect it to be equal to Wave A (-20%). In other words, IF this happens over the coming months, this correction should complete somewhere around 27,400.
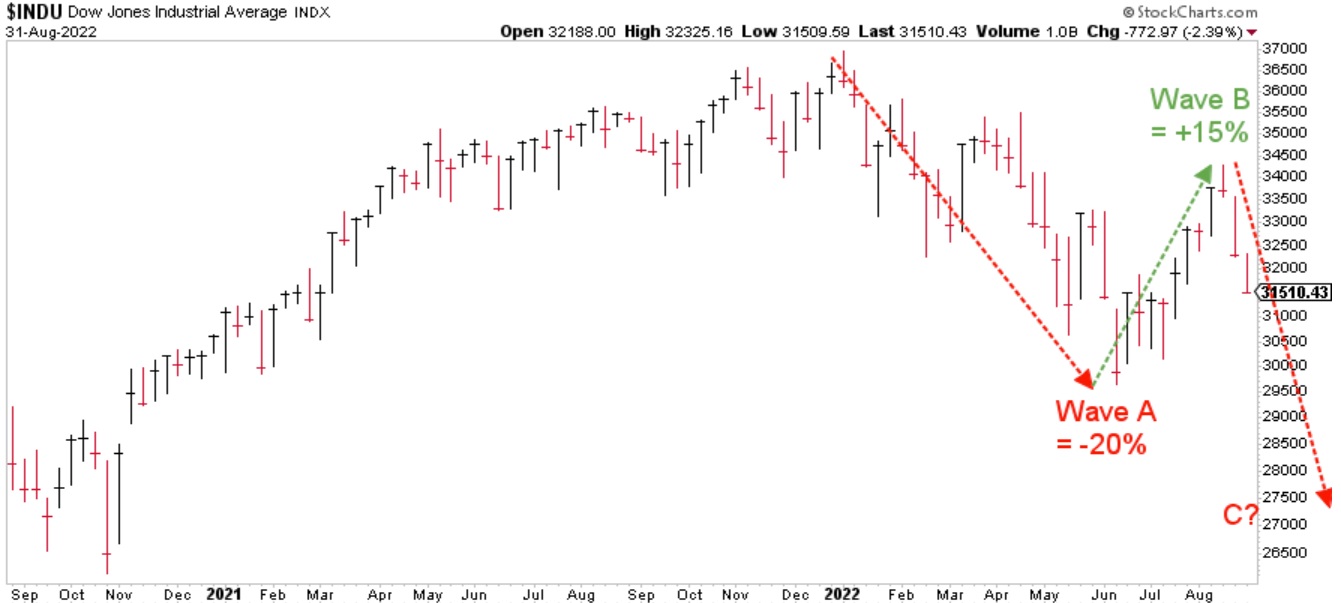
Chart courtesy of StockCharts.com
This is what I am hoping for. Yes, I am hoping the market continues to go lower. Because if it does, then for those of us who have taken ample precautions to become defensive near the top of the stock market may be provided with the opportunity to remove protective hedges and buy stocks on “sale” at much lower prices. And who doesn’t like buying things when they go on sale?
THE “BLUE LINE”: A CLOSER LOOK
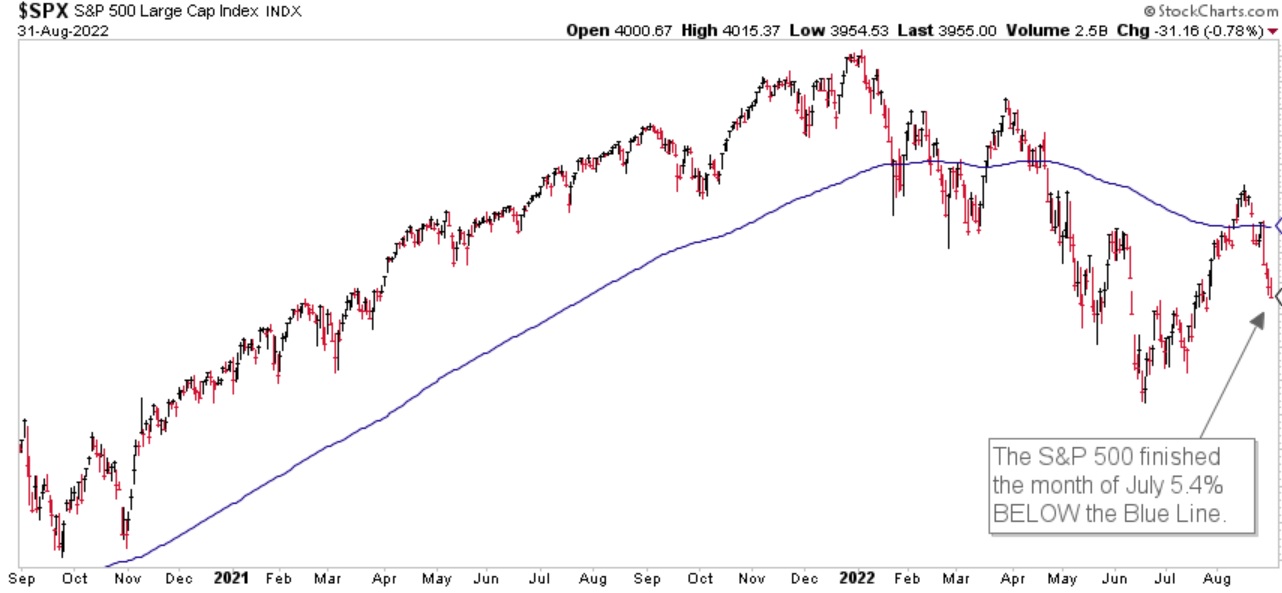
Chart courtesy of StockCharts.com
Returning to the S&P, it finished the month of August 5.40% below the Blue Line, compared to 1.40% below the Blue Line at the end of July.
Thank you for reading this update. If you are not one of our existing clients and would like to learn how our investment process may help you navigate the stock market roller coaster using trends to help grow and preserve your wealth, please call (833) 258-2583.
Jeff Link
Disclaimers:
The BLUE LINE INVESTING® (BLI) investment process was founded on over 95 years of stock market history. It seeks to identify and align investment decisions with multiyear trends. Various aspects of this process have been illustrated in my book Protecting The Pig: How Stock Market Trends Reveal the Way to Grow and Preserve Your Wealth.
The S&P 500 Index is one of the most commonly followed equity indices, and many consider it one of the best representations of the U.S. stock market, and a bellwether for the U.S. economy. It is comprised of 500 large companies having common stock listed on the NYSE or NASDAQ. The volatility (beta) of the account may be greater or less than the index. It is not possible to invest directly in this index.
Technical analysis is a method of evaluating securities by analyzing statistics generated by market activity, such as past prices and volumes. Technical analysis attempts to predict a future stock price or direction based on market trends. The assumption is that the market follows discernible patterns and if these patterns can be identified then a prediction can be made. The risk is that markets may not always follow patterns. There are certain limitations to technical analysis research, such as the calculation results being impacted by changes in security price during periods of market volatility. Technical analysis is one of many indicators that may be used to analyze market data for investing purposes and should not be considered a guaranteed prediction of market activity. The opinions expressed are those of BLI. The opinions referenced are as of the date of publication and are subject to change without notice. BLI reserves the right to modify its current investment strategies based on changing market dynamics or client needs.
Past performance is not indicative of future results. This material is not financial advice or an offer to sell any product. The information contained herein should not be considered a recommendation to purchase or sell any particular security. Forward looking statements cannot be guaranteed.
Guardian Wealth Advisors, LLC (“GWA”) is an investment adviser registered with the U.S. Securities and Exchange Commission. Registration does not imply a certain level of skill or training. More information about GWA’s investment advisory services can be found in its Form CRS or Form ADV Part 2, which is available upon request.
GWA-22-82

