
During October, all three major US stock market indices – the Dow Jones Industrial Average, S&P 500 Index, and NASDAQ Composite – made new closing lows from their previous lows in June. Historically speaking, if all three of these indexes are making new lows together without making new highs, investors should expect a continuation of the trend in motion. Presently, that trend is down. The only index of the three that is nearing a test of its previous high is the Dow. So, until the evidence suggests otherwise, I believe caution continues to be warranted.
PRIMARY TREND: RISING (but correcting)
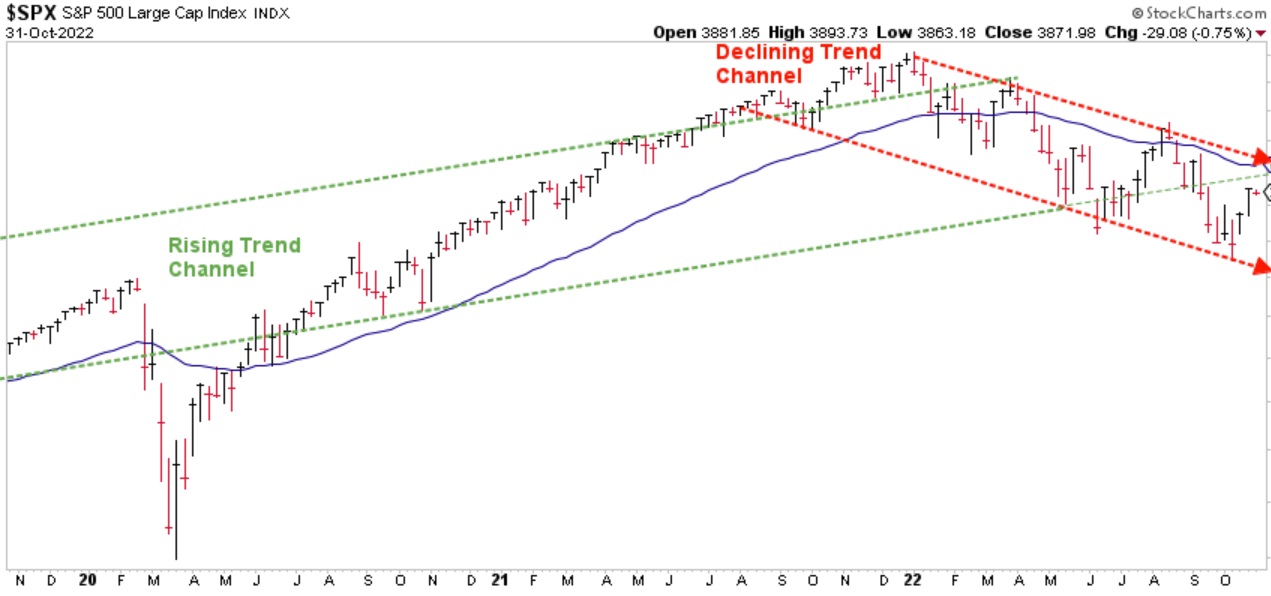
Chart courtesy of StockCharts.com
The chart above has been updated through the end of October and shows the price rally in the S&P 500 is still contained within the downward-sloping declining trend channel. IF this years’ correction continues to unfold as a Channel Correction, we still have just shy of two months for it to complete. Otherwise, it’s possible for this market correction to continue longer and deeper into 2023.
THE “BLUE LINE”: A CLOSER LOOK
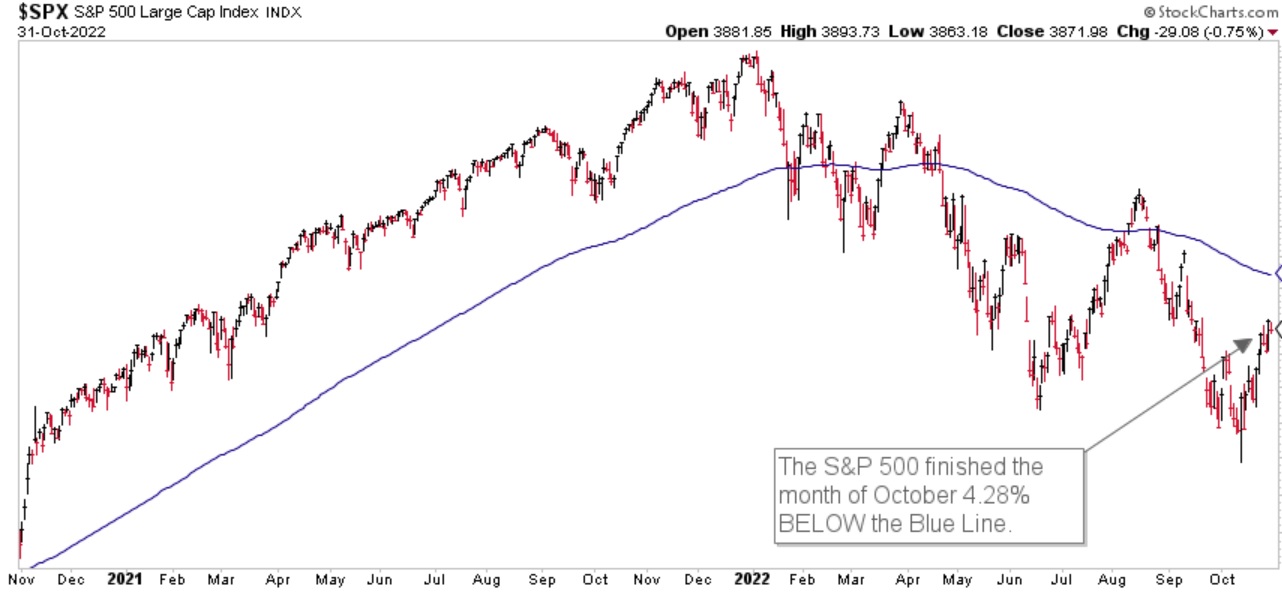
Chart courtesy of StockCharts.com
The S&P finished the month of October 4.28% below the Blue Line, compared to 12.90% below the Blue Line at the end of September. Price continues to remain below the Blue Line, which, according to our process suggests a defensive investment posture.
OUCH!
The chart below is of the iShares TIPS BOND ETF. This is an investment comprised of US Government bonds that are supposed to protect investors during times of rising inflation. As you can see, any investor or investment professional who bought these investments this year has had a most unpleasant surprise.
The purple arrow shows where the price was at the beginning of the year and the red arrow shows where it has been in recent days. This allegedly “safe” investment has lost its investors over 13% year-to-date!
I believe this is another example of how crucial risk management will be for all investors over the years ahead. If inflation protected bonds can drop 13% in a year when inflation is running high, what else may lie ahead that may catch investors surprised and off-guard compared to their expectations?
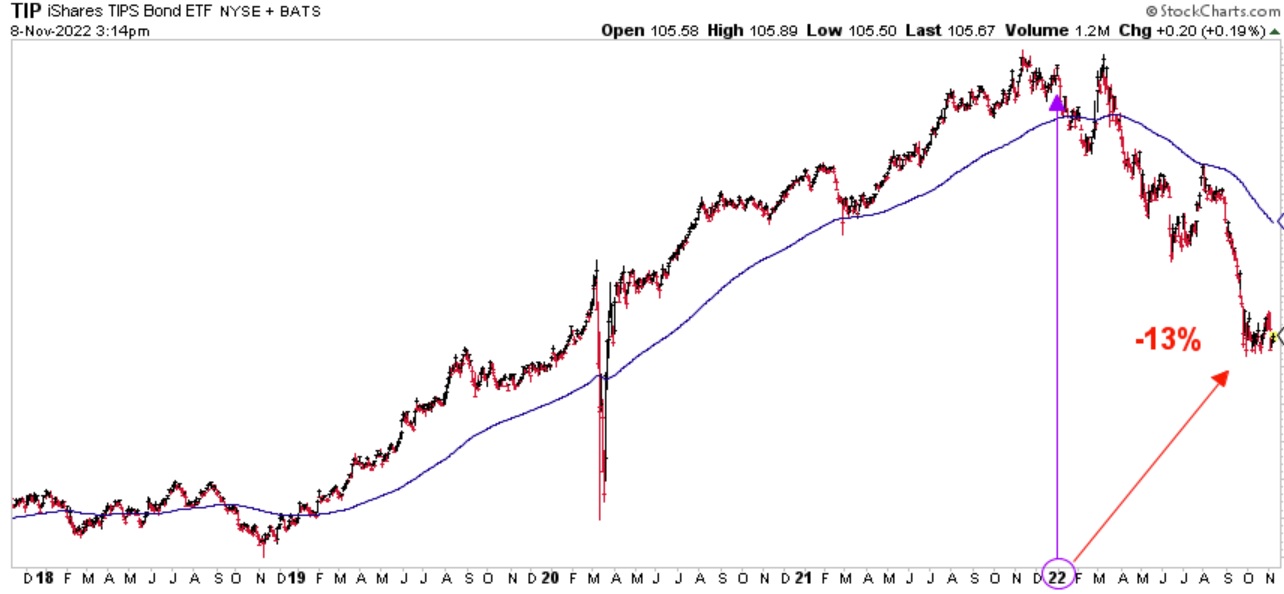
Chart courtesy of StockCharts.com
Thank you for reading this update. If you are not one of our existing clients and would like to learn how our investment process may help you navigate the stock market roller coaster using trends to help grow and preserve your wealth, please call (833) 258-2583.
Jeff Link
Disclaimers:
The BLUE LINE INVESTING® (BLI) investment process was founded on over 95 years of stock market history. It seeks to identify and align investment decisions with multiyear trends. Various aspects of this process have been illustrated in my book Protecting The Pig: How Stock Market Trends Reveal the Way to Grow and Preserve Your Wealth.
The S&P 500 Index is one of the most commonly followed equity indices, and many consider it one of the best representations of the U.S. stock market, and a bellwether for the U.S. economy. It is comprised of 500 large companies having common stock listed on the NYSE or NASDAQ. The volatility (beta) of the account may be greater or less than the index. It is not possible to invest directly in this index.
Technical analysis is a method of evaluating securities by analyzing statistics generated by market activity, such as past prices and volumes. Technical analysis attempts to predict a future stock price or direction based on market trends. The assumption is that the market follows discernible patterns and if these patterns can be identified then a prediction can be made. The risk is that markets may not always follow patterns. There are certain limitations to technical analysis research, such as the calculation results being impacted by changes in security price during periods of market volatility. Technical analysis is one of many indicators that may be used to analyze market data for investing purposes and should not be considered a guaranteed prediction of market activity. The opinions expressed are those of BLI. The opinions referenced are as of the date of publication and are subject to change without notice. BLI reserves the right to modify its current investment strategies based on changing market dynamics or client needs.
Past performance is not indicative of future results. This material is not financial advice or an offer to sell any product. The information contained herein should not be considered a recommendation to purchase or sell any particular security. Forward looking statements cannot be guaranteed.
Guardian Wealth Advisors, LLC (“GWA”) is an investment adviser registered with the U.S. Securities and Exchange Commission. Registration does not imply a certain level of skill or training. More information about GWA’s investment advisory services can be found in its Form CRS or Form ADV Part 2, which is available upon request.
GWA-22-110

