
After six months of price decline, the S&P 500 Index finally experienced a price rally during the month of July that now has the media ablaze. I have even read headlines that suggest a new bull market began in June. I’m sorry to say, but the “old” bull market still hasn’t ended. So far, it appears we are in a “corrective” phase in a rising trend – not an outright change in trend.
Please refer to the pink circle below to see where the market is within the current crossroads of identified rising and declining trend channels:
PRIMARY TREND: RISING (but correcting)
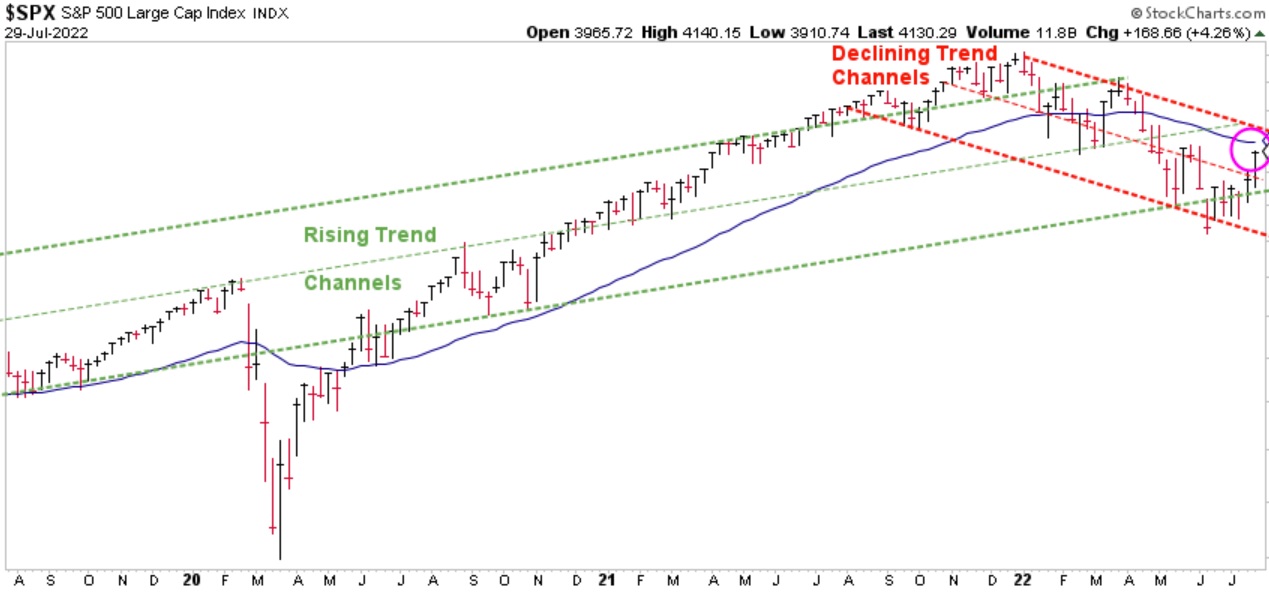
Chart courtesy of StockCharts.com
The type of price rally experienced in July is common during most channel (and trend) corrections. So far, last month appears to be a counter-trend rally in an ongoing channel correction. Take a closer look at the red box and arrow below:
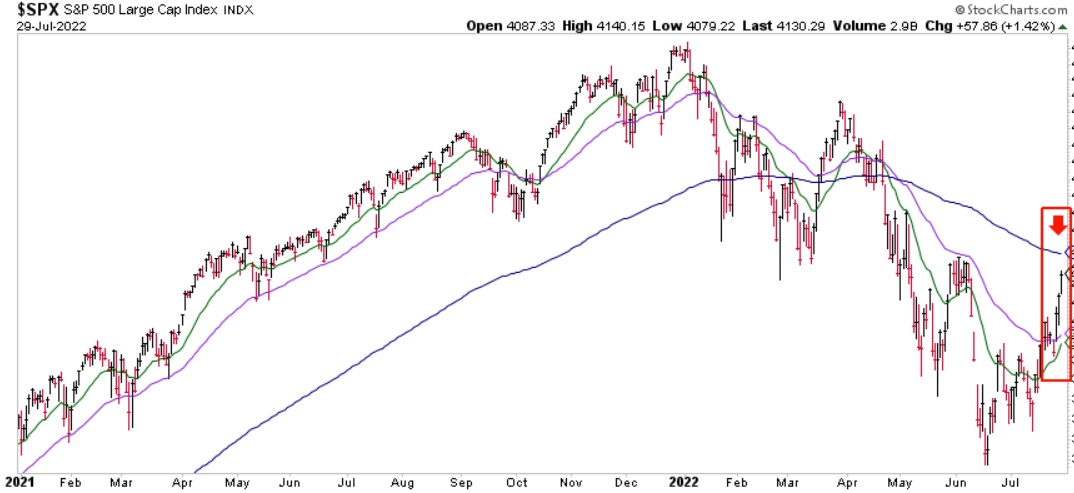
Chart courtesy of StockCharts.com
Price continues to remain under the Blue Line, and the “gap,” or space between the Blue Line and Purple Line is significant. Consider a similar pattern back in late 1969 identified below with the red box and arrow:
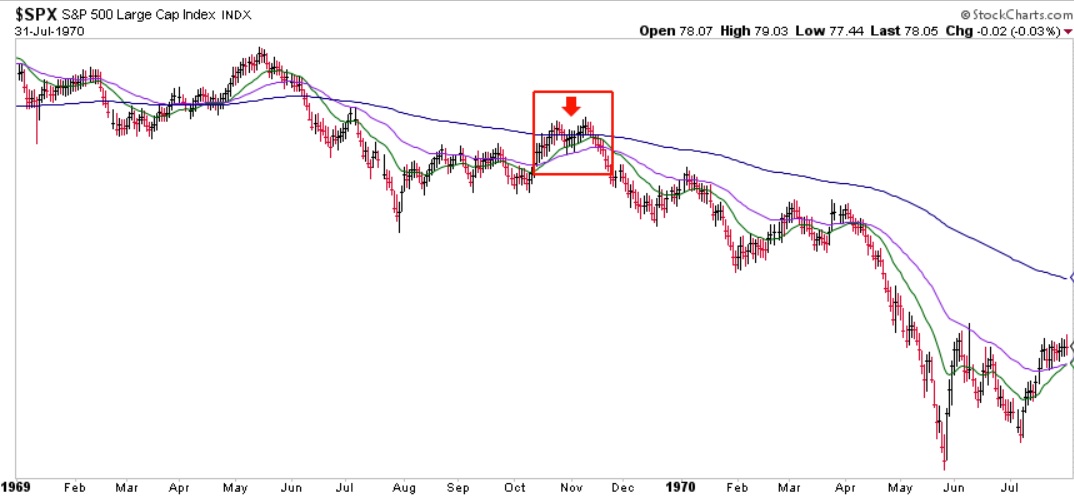
Chart courtesy of StockCharts.com
In 1969 (as one example), the price rally in October stalled around the Blue Line with the Purple Line below. The eventual outcome was a continued price decline. In other words, applying these same patterns to today’s market does not negate the potential for new price lows somewhere ahead – at least not yet.
According to the BLUE LINE INVESTING® process, what I would ideally like to see is price rising above the Blue Line and remaining above it, along with the Purple and Green lines rising above the Blue Line as well. Until that happens, I believe caution is warranted.
THE “BLUE LINE”: A CLOSER LOOK
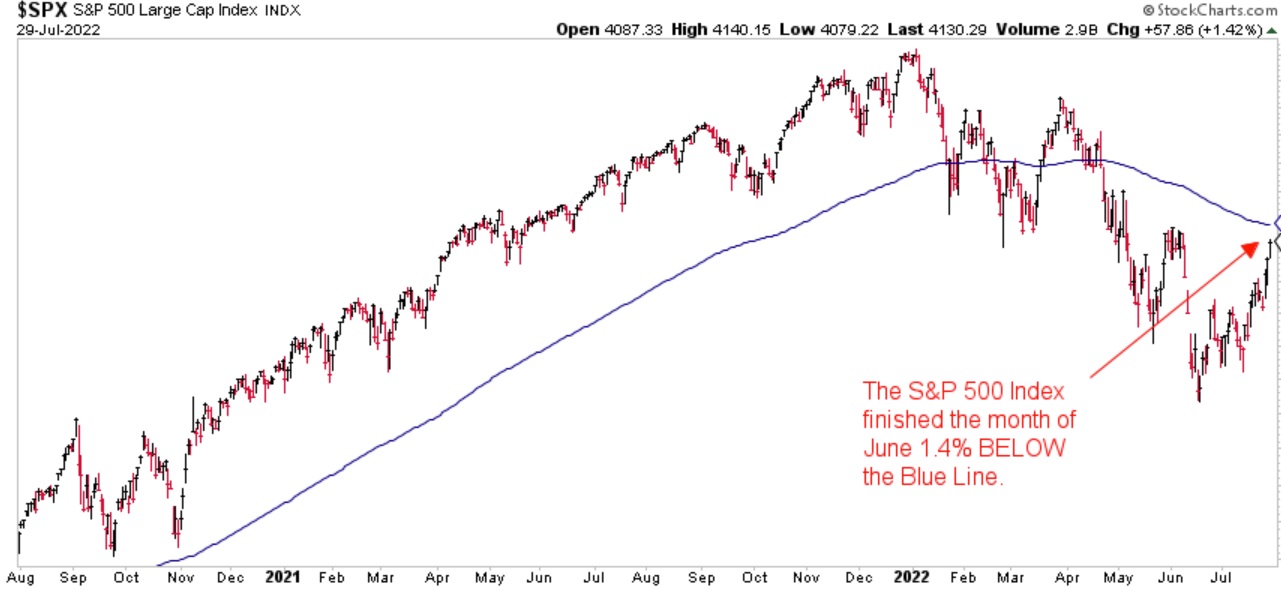
Chart courtesy of StockCharts.com
The S&P finished the month of July 1.40% below the Blue Line, compared to 10.90% below the Blue Line at the end of June.
Thank you for reading this update. If you are not one of our existing clients and would like to learn how our investment process may help you navigate the stock market roller coaster to grow and preserve your wealth, please call (833) 258-2583.
Jeff Link
Disclaimers:
The BLUE LINE INVESTING® (BLI) investment process was founded on over 95 years of stock market history. It seeks to identify and align investment decisions with multiyear trends. Various aspects of this process have been illustrated in my book Protecting The Pig: How Stock Market Trends Reveal the Way to Grow and Preserve Your Wealth.
The S&P 500 Index is one of the most commonly followed equity indices, and many consider it one of the best representations of the U.S. stock market, and a bellwether for the U.S. economy. It is comprised of 500 large companies having common stock listed on the NYSE or NASDAQ. The volatility (beta) of the account may be greater or less than the index. It is not possible to invest directly in this index.
Technical analysis is a method of evaluating securities by analyzing statistics generated by market activity, such as past prices and volumes. Technical analysis attempts to predict a future stock price or direction based on market trends. The assumption is that the market follows discernible patterns and if these patterns can be identified then a prediction can be made. The risk is that markets may not always follow patterns. There are certain limitations to technical analysis research, such as the calculation results being impacted by changes in security price during periods of market volatility. Technical analysis is one of many indicators that may be used to analyze market data for investing purposes and should not be considered a guaranteed prediction of market activity. The opinions expressed are those of BLI. The opinions referenced are as of the date of publication and are subject to change without notice. BLI reserves the right to modify its current investment strategies based on changing market dynamics or client needs.
Past performance is not indicative of future results. This material is not financial advice or an offer to sell any product. The information contained herein should not be considered a recommendation to purchase or sell any particular security. Forward looking statements cannot be guaranteed.
Guardian Wealth Advisors, LLC (“GWA”) is an investment adviser registered with the U.S. Securities and Exchange Commission. Registration does not imply a certain level of skill or training. More information about GWA’s investment advisory services can be found in its Form CRS or Form ADV Part 2, which is available upon request.
GWA-22-72

