
Over the past month the S&P 500 Index (and much of the rest of the stock market) made new price lows. So far, a pattern of “lower highs” and “lower lows” remains intact which is typical during declining stock market trends. The chart below at the far right shows where the S&P finished at the end of June.
PRIMARY TREND: RISING (but correcting)
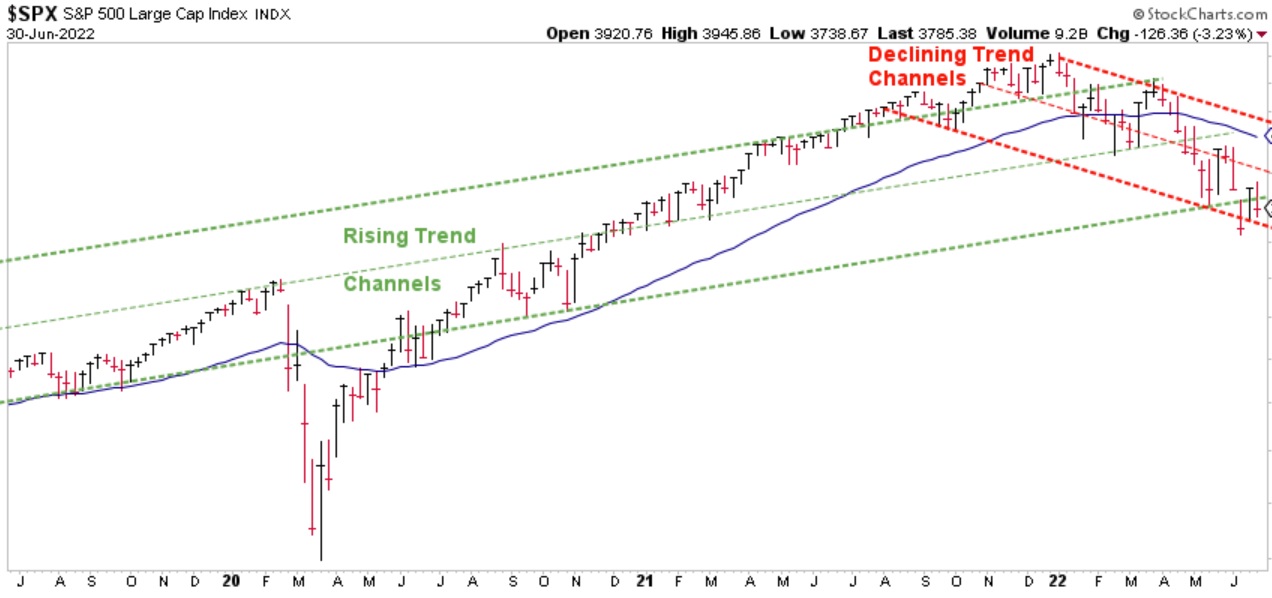
Chart courtesy of StockCharts.com
In my opinion, the price action over the past month opened the door for more potential losses in the future. Please refer to the red arrow in the monthly chart below. The “line in the sand” that I alluded to last month has been crossed.
THE LINE IN THE SAND WAS CROSSED
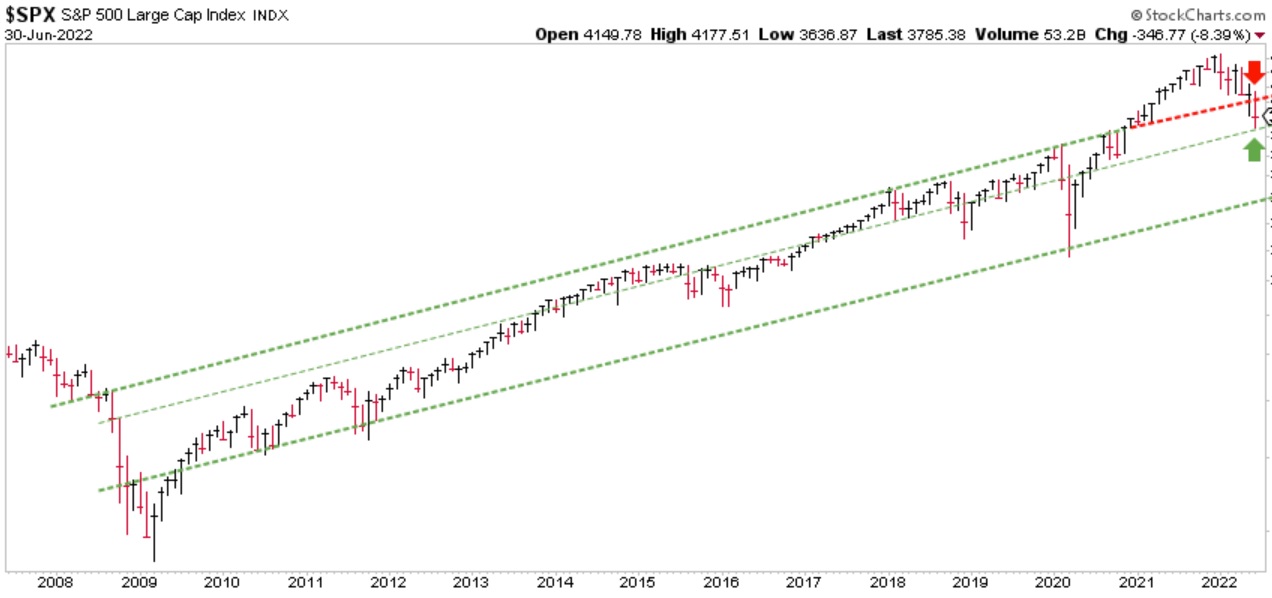
Chart courtesy of StockCharts.com
The key question now is whether the S&P can rally back above the red-dashed line and thereafter remain above it. If not, that line may become a ceiling. Should that happen, I expect additional losses to manifest in the months ahead, maybe even sometime in 2023. But for now, I believe it is very important to pay attention to whether price remains below or can eventually rise above its BLUE LINE (this applies to all investments – not just the S&P 500). Depending on what happens over the next several weeks or months will help determine whether to remain defensive or not.
THE “BLUE LINE”: A CLOSER LOOK
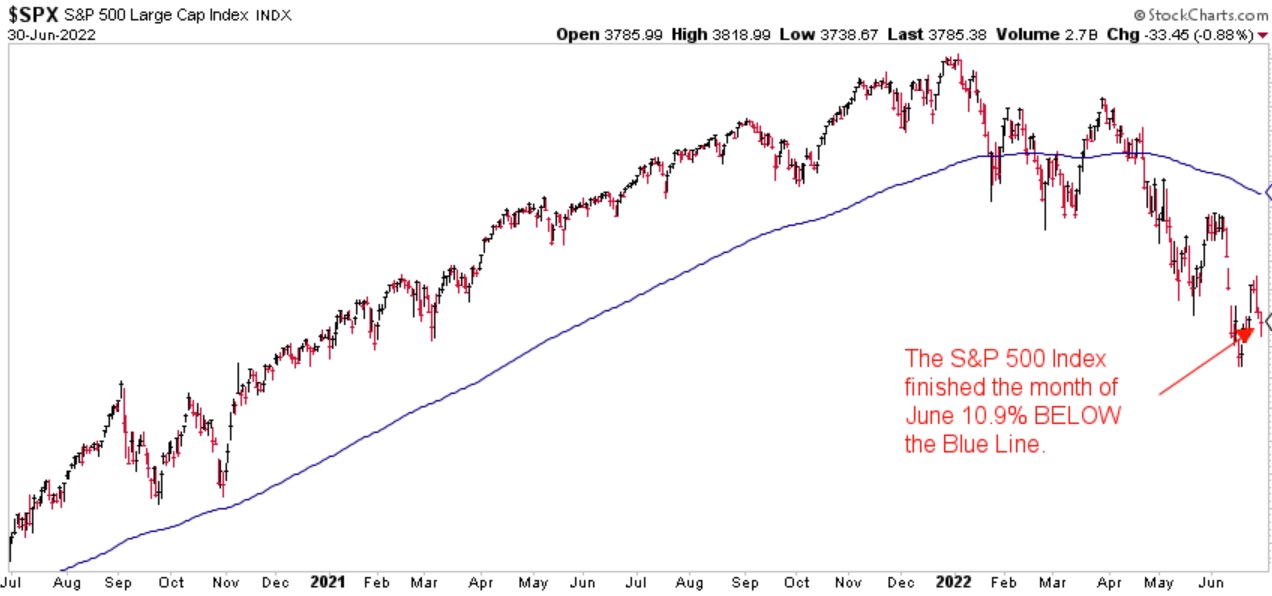
Chart courtesy of StockCharts.com
The S&P finished the month of June 10.90% below the Blue Line, compared to 4.62% below the Blue Line at the end of May.
Thank you for reading this update. If you are not one of our existing clients and would like to learn more about our investment process and how it may help you limit further investment loss, please call (833) 258-2583.
Jeff Link
Disclaimers:
The BLUE LINE INVESTING® (BLI) investment process was founded on over 95 years of stock market history. It seeks to identify and align investment decisions with multiyear trends. Various aspects of this process have been illustrated in my book Protecting The Pig: How Stock Market Trends Reveal the Way to Grow and Preserve Your Wealth.
The S&P 500 Index is one of the most commonly followed equity indices, and many consider it one of the best representations of the U.S. stock market, and a bellwether for the U.S. economy. It is comprised of 500 large companies having common stock listed on the NYSE or NASDAQ. The volatility (beta) of the account may be greater or less than the index. It is not possible to invest directly in this index.
Technical analysis is a method of evaluating securities by analyzing statistics generated by market activity, such as past prices and volumes. Technical analysis attempts to predict a future stock price or direction based on market trends. The assumption is that the market follows discernible patterns and if these patterns can be identified then a prediction can be made. The risk is that markets may not always follow patterns. There are certain limitations to technical analysis research, such as the calculation results being impacted by changes in security price during periods of market volatility. Technical analysis is one of many indicators that may be used to analyze market data for investing purposes and should not be considered a guaranteed prediction of market activity. The opinions expressed are those of BLI. The opinions referenced are as of the date of publication and are subject to change without notice. BLI reserves the right to modify its current investment strategies based on changing market dynamics or client needs.
Past performance is not indicative of future results. This material is not financial advice or an offer to sell any product. The information contained herein should not be considered a recommendation to purchase or sell any particular security. Forward looking statements cannot be guaranteed.
Guardian Wealth Advisors, LLC (“GWA”) is an investment adviser registered with the U.S. Securities and Exchange Commission. Registration does not imply a certain level of skill or training. More information about GWA’s investment advisory services can be found in its Form CRS or Form ADV Part 2, which is available upon request.
GWA-22-64

