
“If the United States is already in recession, how far might the stock market drop from the high to the low?” This question circulated in my mind for weeks, so I decided to do some research to see what I could find. Since history tends to repeat, I believe investors can use the past for guidance to help set future expectations. What I discovered turned out to be a pleasant surprise, and I’ll share why in this article.
The first step I took was to identify the “official” US recessions since the Great Depression, and according to Wikipedia.org, there have been 14. In the table below you can see that three resulted in stock market gains (green), five in moderate losses (yellow), and six in significant losses (red). (Note: I decided to exclude the positive returns from my calculations since I believe the historical circumstances were not relevant to the current economic situation).
Using the S&P 500 Index as the proxy for the stock market, the following approximate cumulative returns were calculated:
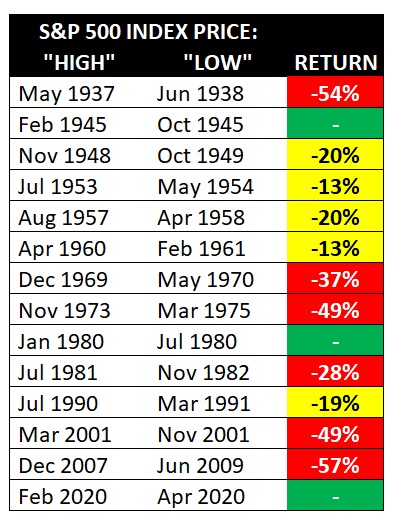
The five moderate losses resulted in an average cumulative loss of -17%, while the six significant losses resulted in an average cumulative loss of -45%. So, at the time I am writing this article, the S&P 500 Index is currently down over 21%. Historically speaking, the potential good news is, there is a 45% chance the worst is over; the potential bad news is a 55% chance remains the market decline is only halfway completed.
Now, you may be wondering why I said above that my research left me pleasantly surprised. In my December 2021 BLUE LINE INVESTING® update, I said the following (https://bluelineinvesting.com/2022/01/the-blue-line-investing-update-december-2021/):
There’s an old saying, “You can’t find what you’re not looking for.” With US stock markets at all-time highs, some investors are throwing caution to the wind and buying into the stock market expecting continued above-average returns. And while it is certainly possible for prices to continue to rise, I believe the probability for a channel correction is high if you know what to look for. Historically, these types of corrections can result in stock market drops between 20 to 35%, typically taking place within twelve months.
So far, everything is playing out as I wrote just six months ago. We are currently six months into a stock market downturn and stock market losses have achieved the front end of my target. Will history repeat with further losses to come? If we calculate the historical average of all 11 negative returns, it comes out to approximately 32% – just shy of the 35% target I referenced above. So, in December, before the losses began, the BLUE LINE INVESTING® process was already anticipating the losses within the range that that are now currently manifesting. By following this process and anticipating the potential risk I had been writing about the entire second half of 2021 in my monthly updates, investment losses for BLUE LINE INVESTING® clients have been significantly limited. If anyone tells you “Nobody could have anticipated this” don’t believe them.
I believe the current stock market downturn offers a tremendous opportunity for many investors – an opportunity to reevaluate: (1) their current investment strategy, and (2) their investment professional(s). I believe these types of environments help differentiate the salespeople from the professionals. If you are dissatisfied with your current investment professional and are not sure what to look for when interviewing someone new, I wrote an entire chapter in my book Protecting The Pig that can help.
Thank you for reading, and if you would like to subscribe to receive my free monthly market updates, please visit www.BlueLineInvesting.com/blog.
Jeff Link
DISCLAIMERS:
The BLUE LINE INVESTING® (BLI) investment process was founded on over 95 years of stock market history. It seeks to identify and align investment decisions with multiyear trends. Various aspects of this process have been illustrated in my book Protecting The Pig: How Stock Market Trends Reveal the Way to Grow and Preserve Your Wealth.
The S&P 500 Index is one of the most commonly followed equity indices, and many consider it one of the best representations of the U.S. stock market, and a bellwether for the U.S. economy. It is comprised of 500 large companies having common stock listed on the NYSE or NASDAQ. The volatility (beta) of the account may be greater or less than the index. It is not possible to invest directly in this index.
Technical analysis is a method of evaluating securities by analyzing statistics generated by market activity, such as past prices and volumes. Technical analysis attempts to predict a future stock price or direction based on market trends. The assumption is that the market follows discernible patterns and if these patterns can be identified then a prediction can be made. The risk is that markets may not always follow patterns. There are certain limitations to technical analysis research, such as the calculation results being impacted by changes in security price during periods of market volatility. Technical analysis is one of many indicators that may be used to analyze market data for investing purposes and should not be considered a guaranteed prediction of market activity. The opinions expressed are those of BLI. The opinions referenced are as of the date of publication and are subject to change without notice. BLI reserves the right to modify its current investment strategies based on changing market dynamics or client needs.
Past performance is not indicative of future results. This material is not financial advice or an offer to sell any product. The information contained herein should not be considered a recommendation to purchase or sell any particular security. Forward looking statements cannot be guaranteed.
Guardian Wealth Advisors, LLC (“GWA”) is an investment adviser registered with the U.S. Securities and Exchange Commission. Registration does not imply a certain level of skill or training. More information about GWA’s investment advisory services can be found in its Form CRS or Form ADV Part 2, which is available upon request.
GWA-22-58

