
This update highlights what I believe is the current stock market trend (i.e. rising, declining, or sideways) as well as the type of risk that may be looming on the horizon (i.e. price, channel, or trend correction). According to the BLUE LINE INVESTING® process, the current primary trend of the US stock market, as measured by the S&P 500 Index (S&P) continues to be defined as a rising trend.
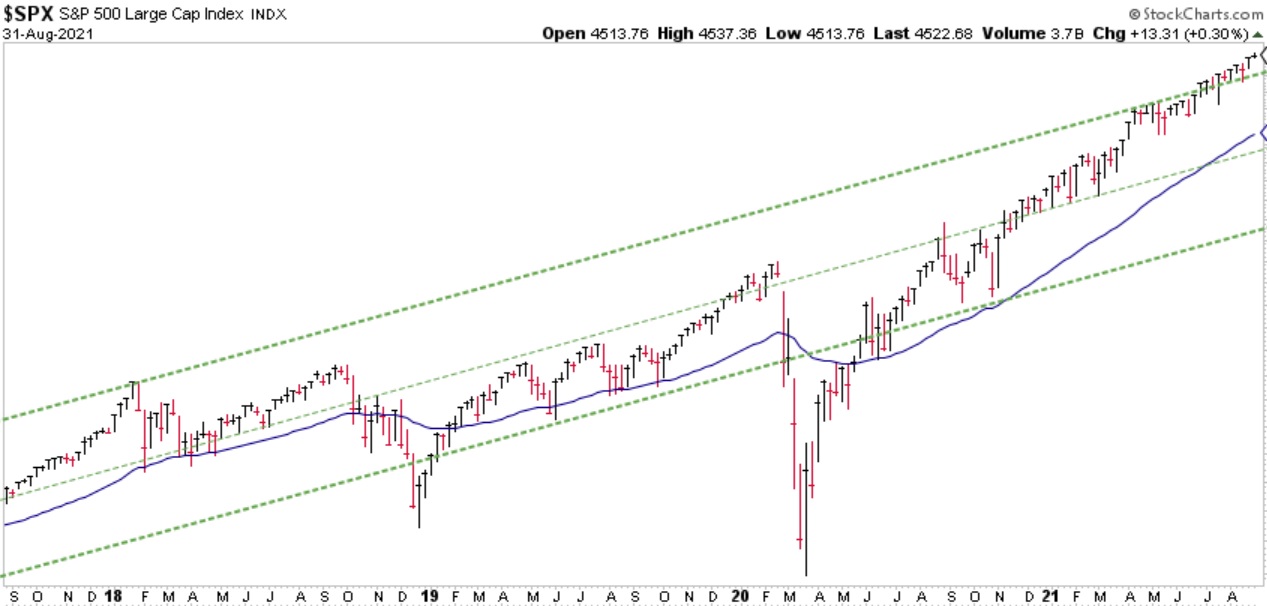
Chart courtesy of StockCharts.com
As stock prices continue to grind higher, a small divergence is becoming more apparent. In other words, as prices continue higher and are breaking out above the top dashed green line, the potential “energy” behind the rising prices is declining. While it is historically possible for this divergence to continue over many weeks and months without a significant price correction taking place, I believe it is not something that should be overlooked at this time. In addition, I am currently monitoring two other indicators that could warn of potential “trouble” ahead.
The first is what is referred to as a Dow Theory Non-Confirmation. In other words, when a stock market is healthy and strong it is desirable to see BOTH the Dow Jones Industrial Average Index (Dow) rising to new highs along with the Dow Jones Transportation Index (Transports). At present, that is not happening right now. This isn’t a reason to be concerned (yet), but I believe is worth paying attention to. Please click the following link if you would like to see an example of a Dow Theory non-confirmation price correction from 2011: https://stockcharts.com/articles/chartwatchers/2011/08/a-dow-theory-non-confirmation-and-sell-signal-indu-tran.html.
The second is that during a rising trend it is desirable for all three major indices to make new highs together. The three indices I am referring to are the Dow, the S&P, and the Nasdaq Composite Index (Nasdaq). As of the date of this article both the S&P and Nasdaq are at new daily highs – but not the Dow. The Dow needs to close above 35,625.40 to confirm the rising trend with the other two indices. If it fails to do so over the coming days and weeks, I believe it could prove to be another warning sign of problems to come.
THE “BLUE LINE”
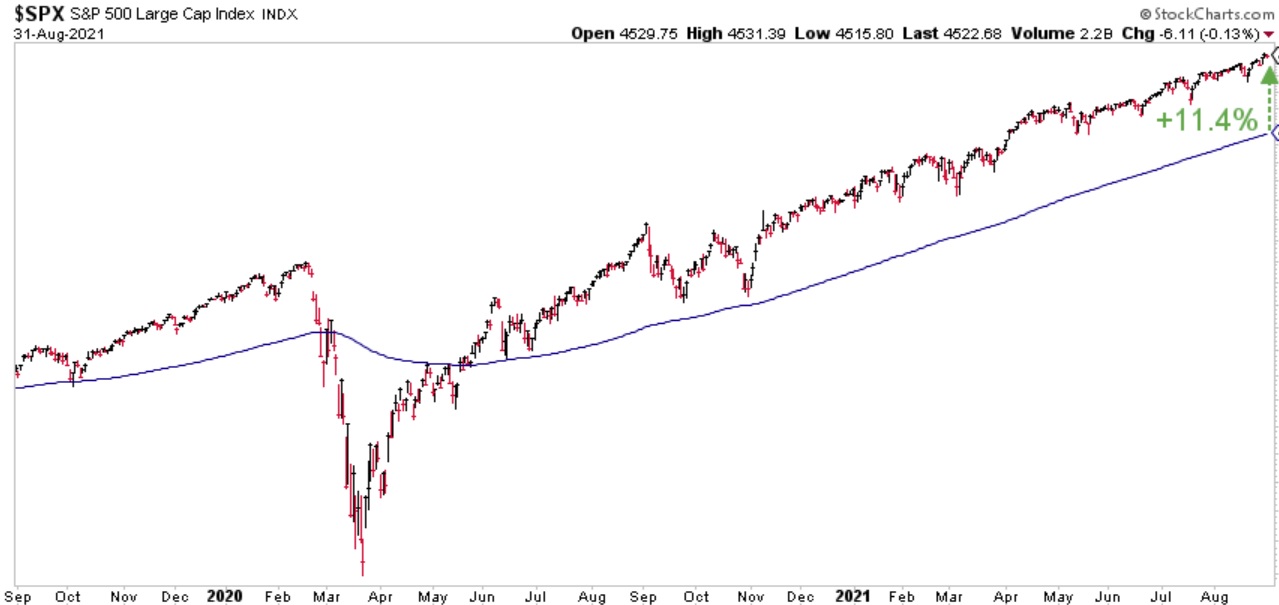
Chart courtesy of StockCharts.com
The S&P finished the month of August 11.4% above the Blue Line, compared to 10.9% above the Blue Line at the end of July (please refer to the green arrow at the far right-hand side of the chart above).
I continue to believe a price correction is the most likely type of risk looming on the horizon, and if it comes to pass, I believe a price decline of approximately 10-12% should not come as a surprise. Until then, I suggest investors sit back and enjoy the rise.
For new clients and those who have made recent contributions to your accounts, I believe a price correction could present a favorable opportunity to purchase stocks – even if only for the short-term.
As a quick reminder, the purpose for providing this monthly update is to illustrate the BLUE LINE INVESTING® process by applying it to the S&P 500 Index. However, this process is applied to all investments held within our strategies.
Thank you for reading and if you know someone who could benefit from a complimentary portfolio risk analysis, please invite them to sign up for a complimentary 30-minute phone or Zoom meeting by going to https://BlueLineInvesting.YouCanBook.Me/.
Jeff Link
Disclaimers:
BLUE LINE INVESTING® (BLI) is an actively managed investment process that pursues our mission by combining a trend following investment philosophy and a “buy low, sell high” investment strategy. Our mission is to grow our client’s financial wealth over a full market cycle in a risk-managed and tax-efficient way.
We monitor the relationship between price and the Blue Line over time to help identify which stock markets worldwide are experiencing rising, sideways, and declining primary trends. We prefer to invest in those markets experiencing rising or sideways primary trends, while avoiding those markets experiencing declining primary trends. The Blue Line helps us identify these trends, and when changes may be taking place.
The S&P 500 Index is one of the most commonly followed equity indices, and many consider it one of the best representations of the U.S. stock market, and a bellwether for the U.S. economy. It is comprised of 500 large companies having common stock listed on the NYSE or NASDAQ. The volatility (beta) of the account may be greater or less than the index. It is not possible to invest directly in this index.
Technical analysis is a method of evaluating securities by analyzing statistics generated by market activity, such as past prices and volumes. Technical analysis attempts to predict a future stock price or direction based on market trends. The assumption is that the market follows discernible patterns and if these patterns can be identified then a prediction can be made. The risk is that markets may not always follow patterns. There are certain limitations to technical analysis research, such as the calculation results being impacted by changes in security price during periods of market volatility. Technical analysis is one of many indicators that may be used to analyze market data for investing purposes and should not be considered a guaranteed prediction of market activity. The opinions expressed are those of BLI. The opinions referenced are as of the date of publication and are subject to change without notice. BLI reserves the right to modify its current investment strategies based on changing market dynamics or client needs.
Past performance is not indicative of future results. This material is not financial advice or an offer to sell any product. The information contained herein should not be considered a recommendation to purchase or sell any particular security. Forward looking statements cannot be guaranteed.
Guardian Wealth Advisors, LLC (“GWA”) is an investment adviser registered with the U.S. Securities and Exchange Commission. Registration does not imply a certain level of skill or training. More information about GWA’s investment advisory services can be found in its Form ADV Part 2, which is available upon request.
GWA-21-49

