
Over recent months I have written about my belief that the next risk investors will likely face is a Price Correction. For readers who have read my book Protecting The Pig: How Stock Market Trends Reveal the Way to Grow and Preserve Your Wealth, please refer to Chapter 5 for a quick refresher.
For those readers who have not read my book, I want to illustrate what this type of risk looks like from a historical perspective. Please refer to the chart below of the current pattern of the rising trend in the S&P 500 Index (S&P) for the eighteen months ending August 12, 2021. According to the BLUE LINE INVESTING® process, the ideal rising trend pattern is illustrated below: price trends above the Green Line; the Green Line above the Purple Line; and the Purple Line above the Blue Line. I believe this is a very healthy trend for all investors – regardless of age or personal circumstances.
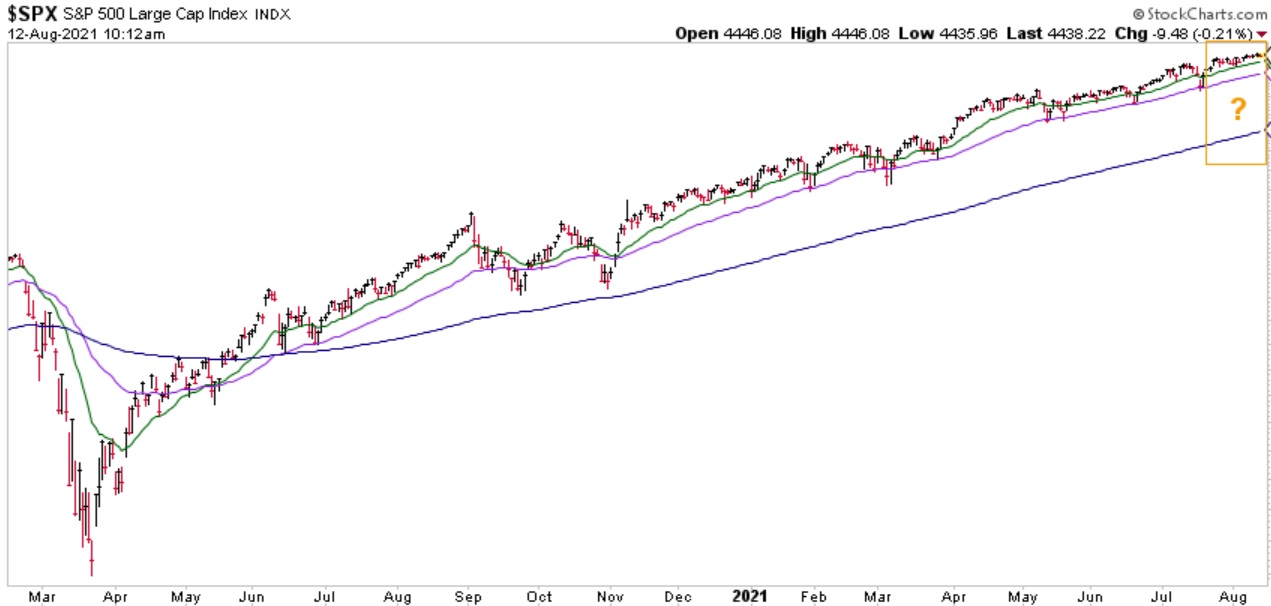
Chart courtesy of StockCharts.com
Next, let’s go back in history and see what Price Corrections have looked like in the past. For illustrative purposes I will use the eighteen-month period ending December 31, 1997. Please see below.
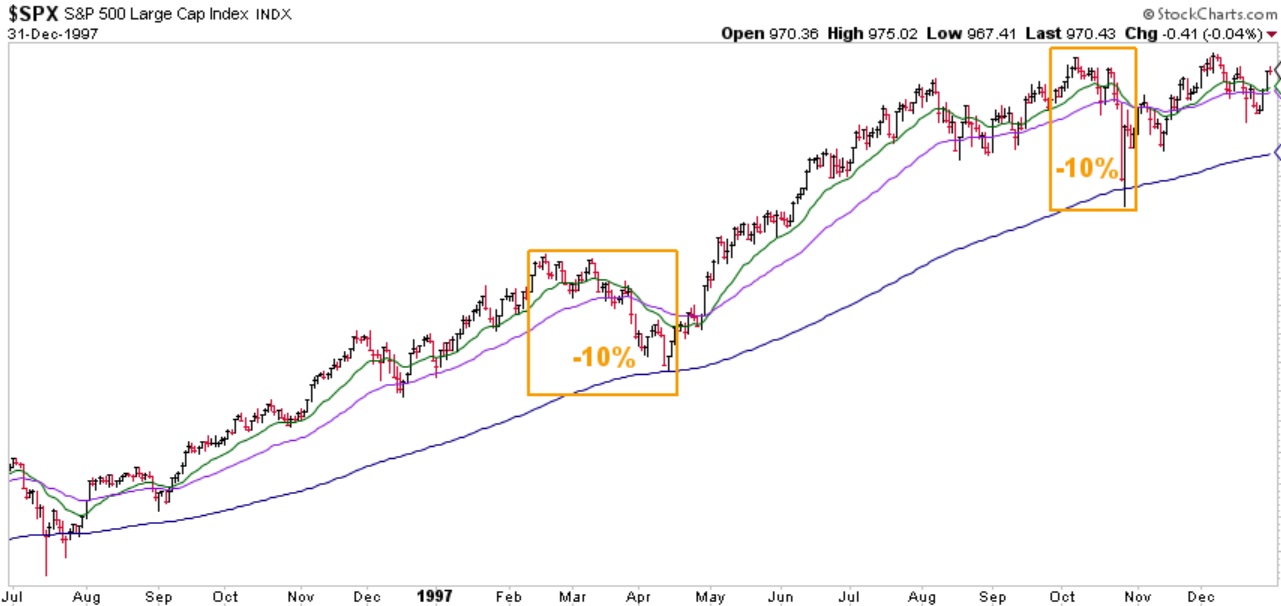
Chart courtesy of StockCharts.com
In the chart above you can see the relatively same pattern that took place during a rising trend in 1996 and 1997. But in both the early and later part of 1997, price corrections occurred in the S&P amounting to approximately 10% in “losses.” Price corrected to the Blue Line before bouncing off and eventually rising higher. I have highlighted these two occurrences with the orange-colored boxes in the chart above. So, what do I believe are the two key takeaways from what I am showing you?
First, I believe at some point in the future price is going to correct to the Blue Line once again. If it were to do so in the coming weeks or months, it would also equate to approximately 10% in “losses” (please refer to the orange-colored box on the first chart in the upper right-hand corner).
Second, if this happens, I believe it could provide new investors, or those who have added money to their accounts in recent months, an attractive opportunity to buy in at what I consider to be a potential “buying opportunity.” Based on other indicators not shown in the charts above, I believe this type of price correction would likely be short-term and temporary in nature.
Thank you for reading and please feel free to share this article with anyone you believe may find it beneficial.
Jeff Link
Disclaimers:
BLUE LINE INVESTING® (BLI) is an actively managed investment process that pursues our mission by combining a trend following investment philosophy and a “buy low, sell high” investment strategy. Our mission is to grow our client’s financial wealth over a full market cycle in a risk-managed and tax-efficient way.
We monitor the relationship between price and the Blue Line over time to help identify which stock markets worldwide are experiencing rising, sideways, and declining primary trends. We prefer to invest in those markets experiencing rising or sideways primary trends, while avoiding those markets experiencing declining primary trends. The Blue Line helps us identify these trends, and when changes may be taking place.
The S&P 500 Index is one of the most commonly followed equity indices, and many consider it one of the best representations of the U.S. stock market, and a bellwether for the U.S. economy. It is comprised of 500 large companies having common stock listed on the NYSE or NASDAQ. The volatility (beta) of the account may be greater or less than the index. It is not possible to invest directly in this index.
Technical analysis is a method of evaluating securities by analyzing statistics generated by market activity, such as past prices and volumes. Technical analysis attempts to predict a future stock price or direction based on market trends. The assumption is that the market follows discernible patterns and if these patterns can be identified then a prediction can be made. The risk is that markets may not always follow patterns. There are certain limitations to technical analysis research, such as the calculation results being impacted by changes in security price during periods of market volatility. Technical analysis is one of many indicators that may be used to analyze market data for investing purposes and should not be considered a guaranteed prediction of market activity. The opinions expressed are those of BLI. The opinions referenced are as of the date of publication and are subject to change without notice. BLI reserves the right to modify its current investment strategies based on changing market dynamics or client needs.
Past performance is not indicative of future results. This material is not financial advice or an offer to sell any product. The information contained herein should not be considered a recommendation to purchase or sell any particular security. Forward looking statements cannot be guaranteed.
Guardian Wealth Advisors, LLC (“GWA”) is an investment adviser registered with the U.S. Securities and Exchange Commission. Registration does not imply a certain level of skill or training. More information about GWA’s investment advisory services can be found in its Form ADV Part 2, which is available upon request.
GWA-21-45

