
This monthly update highlights my belief of the current stock market trend (i.e. rising, declining, or sideways) as well as the type of risk that may be looming on the horizon (i.e. price, channel, or trend correction). It is intended to help readers set realistic expectations for the future and to help our clients better understand why we have their accounts invested as they are.
According to the BLUE LINE INVESTING® process, the current primary trend of the US stock market, as measured by the S&P 500 Index (S&P) continues to be defined as a rising trend.
PRIMARY TREND: RISING
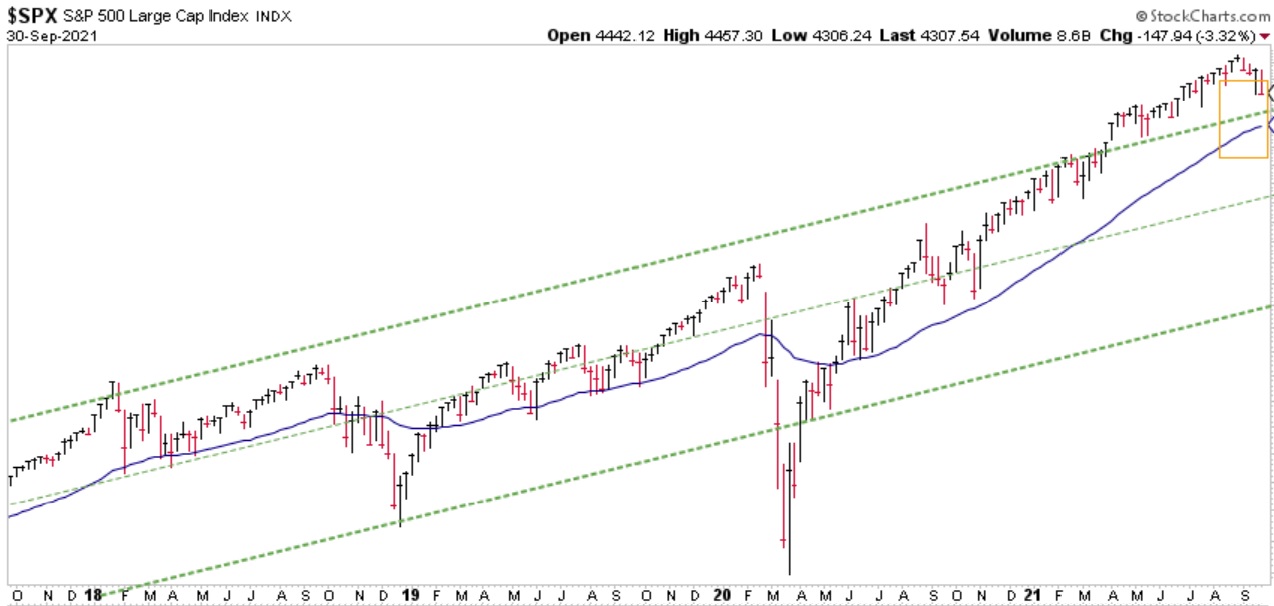
Chart courtesy of StockCharts.com
From the chart above you can see that price rose above the top dashed green line in the second quarter of this year. However, with the S&P down 7% from its recent high it appears the price correction I have been warning about over recent months is underway. Whether this proves to be a short-term price correction or not is yet to be determined. If I have correctly identified the trend channels illustrated above (i.e., the dashed green lines), I believe there are two important observations to pay attention to going forward.
The first is the bullish, or positive scenario. IF price declines further and bounces off the rising dashed green line (and the Blue Line), it is likely the rising trend could continue higher over the months to come. If that is the case, this price correction may prove to be an attractive entry point for new investors or those investors who have added new money to their account(s) in recent months.
The second however, is the bearish, or negative scenario. IF price declines further, falling below and remaining below both the green-dashed line and the Blue Line, we may be looking at a channel correction. This type of correction tends to last longer with prices declining further. If this scenario plays out over the coming weeks and/or months, holding cash and cash equivalents, or even adding inverse-ETF’s may prove helpful to attempt to limit future investment loss. For those readers interested in reading more on these two concepts, please refer to Chapters 5 and 7 of my book Protecting The Pig.
Historically speaking, I have found investment risk tends to be high when the Blue Line aligns with the top of the trend channel (please refer to the orange box in the chart above). While I personally hope the former scenario plays out, I believe it is prudent to be prepared for the latter.
THE “BLUE LINE”
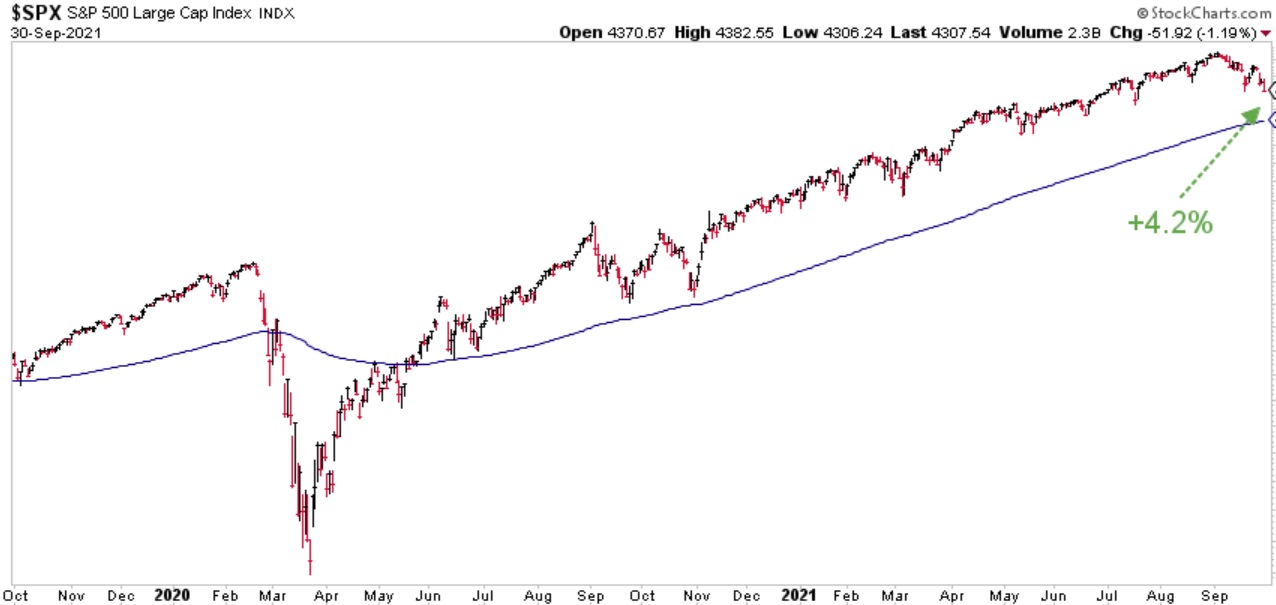
Chart courtesy of StockCharts.com
The S&P finished the month of September 4.2% above the Blue Line, compared to 11.4% above the Blue Line at the end of August (please refer to the green arrow at the far right-hand side of the chart above). So far price continues to remain above the Blue Line which I believe is positive.
As a quick reminder, the purpose for providing this monthly update is to illustrate the BLUE LINE INVESTING® process by applying it to the S&P 500 Index. However, this process is applied to all investments held within our strategies.
Thank you for reading this primary trend update. If you have found it insightful and helpful, please share it with others or on your favorite social media platform.
Jeff Link
Disclaimers:
BLUE LINE INVESTING® (BLI) is an actively managed investment process that pursues our mission by combining a trend following investment philosophy and a “buy low, sell high” investment strategy. Our mission is to grow our client’s financial wealth over a full market cycle in a risk-managed and tax-efficient way.
We monitor the relationship between price and the Blue Line over time to help identify which stock markets worldwide are experiencing rising, sideways, and declining primary trends. We prefer to invest in those markets experiencing rising or sideways primary trends, while avoiding those markets experiencing declining primary trends. The Blue Line helps us identify these trends, and when changes may be taking place.
The S&P 500 Index is one of the most commonly followed equity indices, and many consider it one of the best representations of the U.S. stock market, and a bellwether for the U.S. economy. It is comprised of 500 large companies having common stock listed on the NYSE or NASDAQ. The volatility (beta) of the account may be greater or less than the index. It is not possible to invest directly in this index.
Technical analysis is a method of evaluating securities by analyzing statistics generated by market activity, such as past prices and volumes. Technical analysis attempts to predict a future stock price or direction based on market trends. The assumption is that the market follows discernible patterns and if these patterns can be identified then a prediction can be made. The risk is that markets may not always follow patterns. There are certain limitations to technical analysis research, such as the calculation results being impacted by changes in security price during periods of market volatility. Technical analysis is one of many indicators that may be used to analyze market data for investing purposes and should not be considered a guaranteed prediction of market activity. The opinions expressed are those of BLI. The opinions referenced are as of the date of publication and are subject to change without notice. BLI reserves the right to modify its current investment strategies based on changing market dynamics or client needs.
Past performance is not indicative of future results. This material is not financial advice or an offer to sell any product. The information contained herein should not be considered a recommendation to purchase or sell any particular security. Forward looking statements cannot be guaranteed.
Guardian Wealth Advisors, LLC (“GWA”) is an investment adviser registered with the U.S. Securities and Exchange Commission. Registration does not imply a certain level of skill or training. More information about GWA’s investment advisory services can be found in its Form ADV Part 2, which is available upon request.
GWA-21-57

