
In last month’s update I stated, “I believe to have a chance to proactively manage investment risk it is crucial to identify when investment risks are increasing and before they manifest.” Unfortunately, without knowing what to look for, investors often take action after the losses have manifested. Consider Rebecca’s story as a case in point.
Rebecca owned shares of General Electric Co. common stock (symbol: GE) in her investment account for decades. Neither she, nor any of her previous investment professionals ever had an inclination to sell it, because after all, it was GE. Unfortunately, this complacency cost her dearly when she suffered significant investment loss as the stock declined over 75% during 2017 and 2018. Please refer to Chart A below that shows the stock price from 2010 through 2018.
CHART A
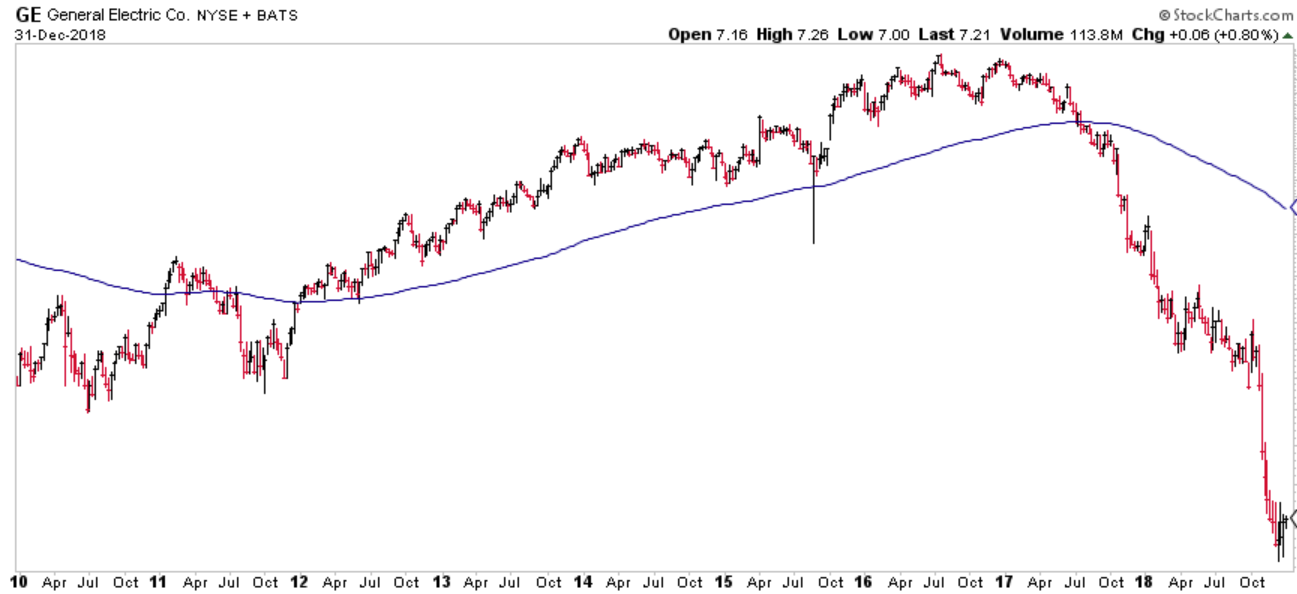
Chart courtesy of StockCharts.com
Rebecca, who was in her mid-80’s at the time she sold her shares, took action long after they lost a significant amount of value. In other words, she reacted to what happened, rather than anticipated what might be about to happen.
While no one has a crystal ball, I believe there were warning signs that may have alerted her (and her investment professionals) to at least consider selling some or all the shares to help preserve the value of her investment. Look at Chart B below.
CHART B
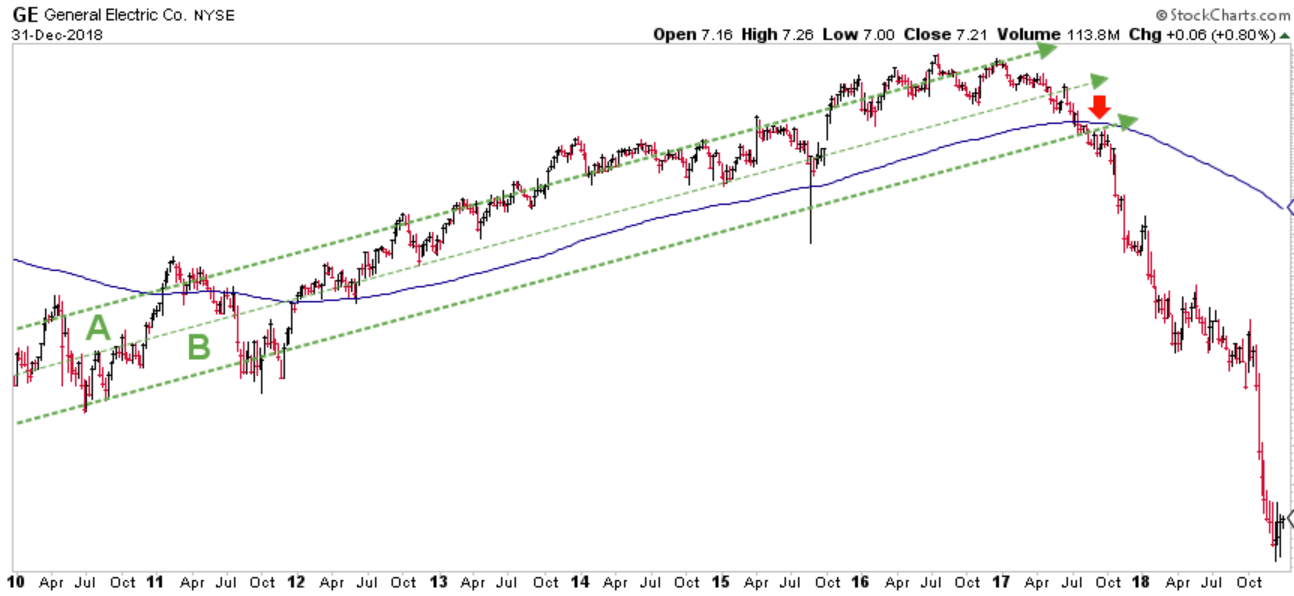
Chart courtesy of StockCharts.com
I covered this concept in detail in Chapter 6 of my book. For most of the five years that preceded the price decline, GE stock traded in a single trend channel labeled “A” above. Eventually, the sellers outnumbered the buyers, energy faded, and price began declining. Two important warning signs above came from:
- Price declined below and remained below the Blue Line, and
- Price broke down through the green-dashed support line of the trend channel labeled “B.”
I believe these indicators were a warning of further losses to come. Granted, to keep this concept relatively simple, I have not shown additional indicators that must be present to realize a pattern has formed. But I believe once this pattern of “investor behavior” is recognized and understood, and all indicators align, it affords an investor the opportunity to take proactive action.
Over the next few months, I will illustrate other investments that I believe have followed this same pattern throughout history to prove it is not an isolated example. My reason for showing you this is simple – once we understand the pattern, we may be able to use it to help limit (or even avoid) catastrophic investment loss, and thereby helping protect your wealth.
BLUE LINE Perspective (A Trend Indicator)
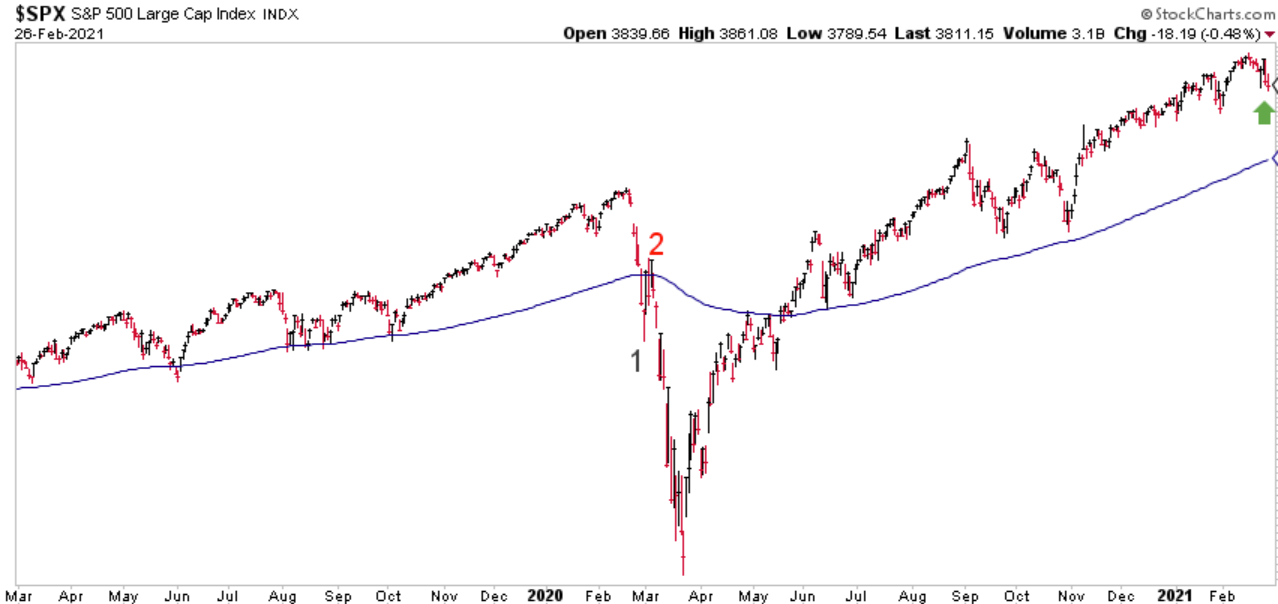
Chart courtesy of StockCharts.com
According to the BLUE LINE INVESTING® process, the current primary trend is defined as a rising trend. The US stock market, as measured by the S&P 500 Index (S&P), finished the month of February 8.8% above the Blue Line, compared to 8.4% above the Blue Line at the end of January (please refer to the green arrow at the far right-hand side of the chart above).
If you know someone who needs help investing their wealth but is worried about of suffering significant investment loss, please invite them to sign up for a complimentary 30-minute phone call by going to BlueLineInvesting.YouCanBook.Me.
As a quick reminder, the purpose for providing this monthly update is to illustrate the BLUE LINE INVESTING® process by applying it to the S&P 500 Index. However, this process is applied to all investments held within our strategies. Thank you for reading and please share with anyone you know who may be interested.
Jeff Link
Disclaimers:
BLUE LINE INVESTING® (BLI) is an actively managed investment process that pursues our mission by combining a trend following investment philosophy and a “buy low, sell high” investment strategy. Our mission is to grow our client’s financial wealth over a full market cycle in a risk-managed and tax-efficient way.
We monitor the relationship between price and the Blue Line over time to help identify which stock markets worldwide are experiencing rising, sideways, and declining primary trends. We prefer to invest in those markets experiencing rising or sideways primary trends, while avoiding those markets experiencing declining primary trends. The Blue Line helps us identify these trends, and when changes may be taking place.
The S&P 500 Index is one of the most commonly followed equity indices, and many consider it one of the best representations of the U.S. stock market, and a bellwether for the U.S. economy. It is comprised of 500 large companies having common stock listed on the NYSE or NASDAQ. The volatility (beta) of the account may be greater or less than the index. It is not possible to invest directly in this index.
Technical analysis is a method of evaluating securities by analyzing statistics generated by market activity, such as past prices and volumes. Technical analysis attempts to predict a future stock price or direction based on market trends. The assumption is that the market follows discernible patterns and if these patterns can be identified then a prediction can be made. The risk is that markets may not always follow patterns. There are certain limitations to technical analysis research, such as the calculation results being impacted by changes in security price during periods of market volatility. Technical analysis is one of many indicators that may be used to analyze market data for investing purposes and should not be considered a guaranteed prediction of market activity. The opinions expressed are those of BLI. The opinions referenced are as of the date of publication and are subject to change without notice. BLI reserves the right to modify its current investment strategies based on changing market dynamics or client needs.
Past performance is not indicative of future results. This material is not financial advice or an offer to sell any product. The information contained herein should not be considered a recommendation to purchase or sell any particular security. Forward looking statements cannot be guaranteed.
Guardian Wealth Advisors, LLC (“GWA”) is an investment adviser registered with the U.S. Securities and Exchange Commission. Registration does not imply a certain level of skill or training. More information about GWA’s investment advisory services can be found in its Form ADV Part 2, which is available upon request.
GWA-21-14

