
Last month I illustrated what I believe is a “pattern” of investor behavior that preceded significant losses to investors in GE common stock. In this month’s update I will illustrate what I believe was a similar pattern that took place in Boeing Co. stock (symbol: BA) in recent years. Before I do, I will reiterate my reason for doing so.
Chapter 5 of my book is called The “Faces” of Risk and I included it to illustrate what I believe are three distinct types of historical investment risk that investors will encounter when investing in the stock market. I call these types of risk a price correction, channel correction, and trend correction and each one has a different degree of potential investment loss. To summarize the chapter, I believe a price correction is a “low” risk event, a channel correction is a “moderate” risk event, and a trend correction is a “high” risk event.
As I have stated before, I believe it is possible to attempt to limit or avoid sustained and significant investment loss if we can recognize these patterns as they begin to manifest. In doing so, I believe it offers an opportunity to take proactive and defensive action with stock investments to limit potential loss, thereby offering the opportunity to increase longer-term investment returns. With that said, look at BA below in Chart A.
CHART A
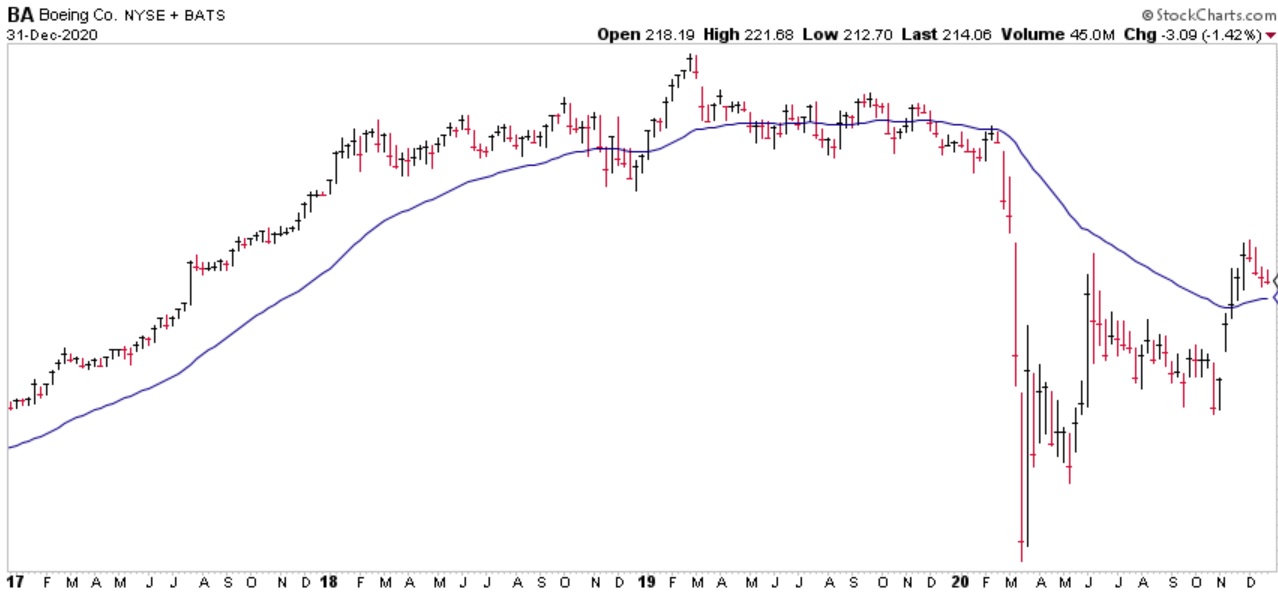
Chart courtesy of StockCharts.com
The chart above shows BA rising during calendar year 2017, then consolidating during 2018 and 2019, and then crashing in early 2020. Price dropped from the mid-$300’s to below $100 per share, losing more than 70%. While in hindsight anyone would attribute the crash to the virus outbreak and shutdown of air travel, the question arises if there were warning signs in advance? Let us look at BA from the perspective of what we saw with GE last month.
CHART B
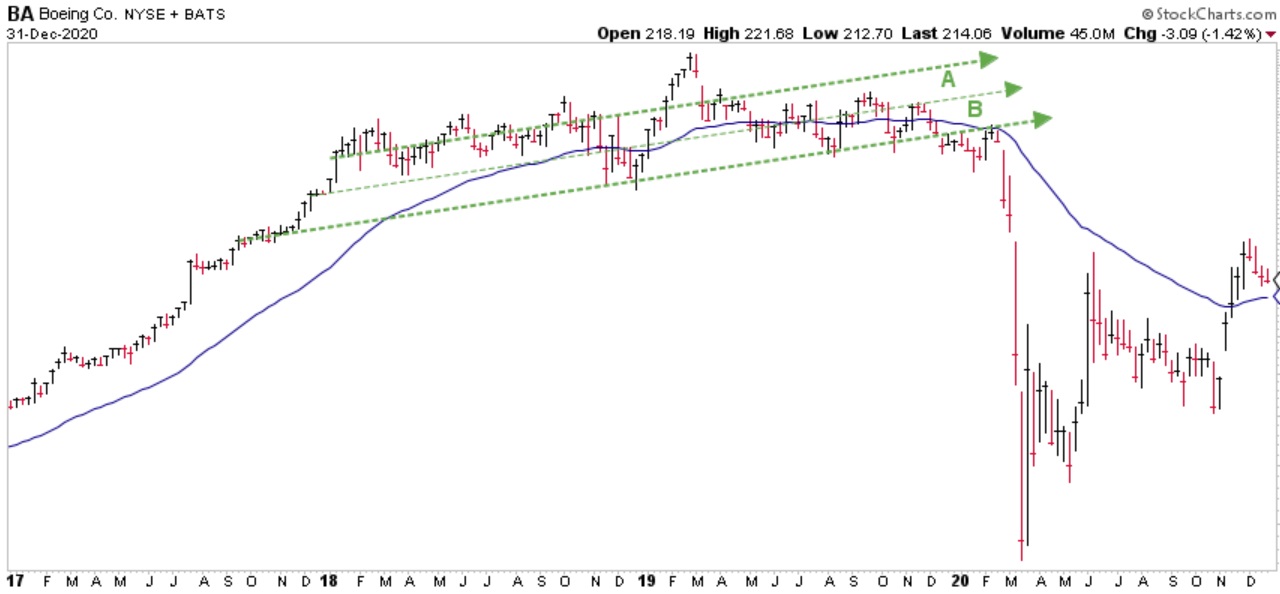
Chart courtesy of StockCharts.com
Just like GE, I believe there were two important warning signs before the price crash:
- Price broke down through the green-dashed support line of the trend channel labeled “B”, and,
- By dropping 5% below the Blue Line in late 2019/early 2020 a Phase 1: WARNING! took place, followed by a Phase 2: FAILURE to get back above the Blue Line.
For readers interested in more detail please refer to Chapter 6 of my book, “When Selling May Be Your Best Option.” Now, there are other indicators that must align with this pattern to increase the probability of investment loss, but they are not being shown. I simply want to show you the same broad pattern – using trend channels – to help illustrate the pattern.
Over the next couple months, I will show 2 or 3 more charts to further illustrate this pattern as I believe repetition is helpful to prove something may not be an isolated event.
BLUE LINE Perspective (A Trend Indicator)
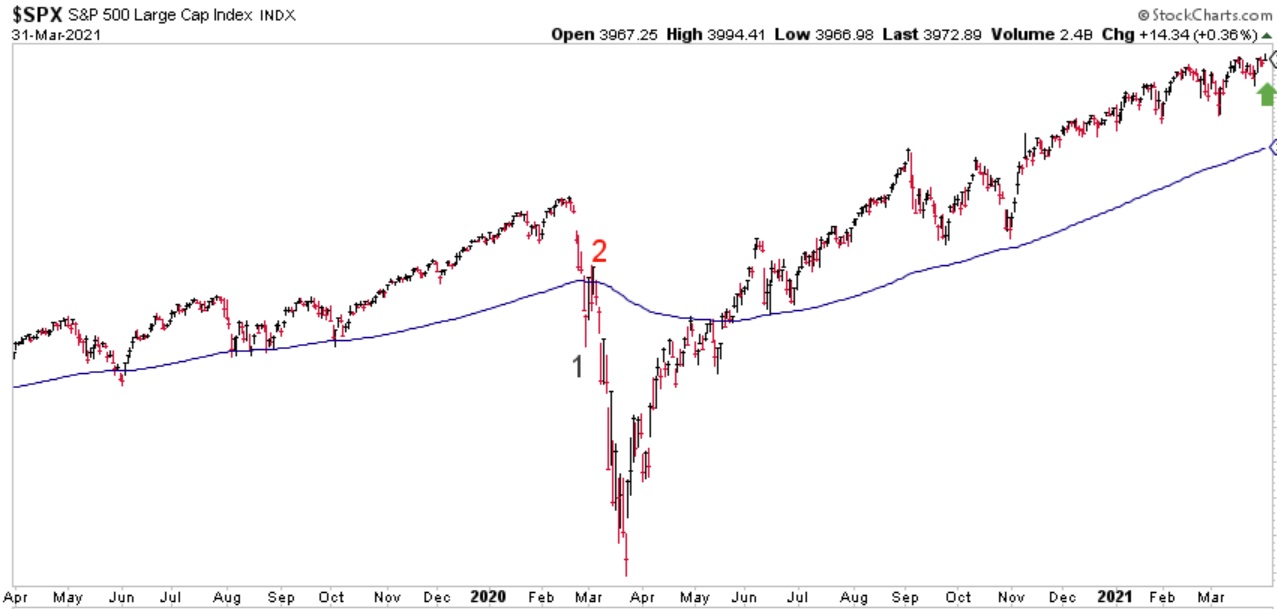
Chart courtesy of StockCharts.com
According to the BLUE LINE INVESTING® process, the current primary trend is defined as a rising trend. The US stock market, as measured by the S&P 500 Index (S&P), finished the month of February 10.7% above the Blue Line, compared to 8.8% above the Blue Line at the end of February (please refer to the green arrow at the far right-hand side of the chart above).
At this time, the most likely type of correction investors face based on the position of price and the Blue Line (as well as other indicators) is a price correction. Please understand, this is not a prediction. I am simply pointing out what appears most likely at some point in the future.
As a quick reminder, the purpose for providing this monthly update is to illustrate the BLUE LINE INVESTING® process by applying it to the S&P 500 Index. However, this process is applied to all investments held within our strategies. Thank you for reading and if you know someone who needs help investing their wealth but is worried about of suffering significant investment loss, please invite them to sign up for a complimentary 30-minute phone call by going to https://BlueLineInvesting.YouCanBook.Me/.
Jeff Link
Disclaimers:
BLUE LINE INVESTING® (BLI) is an actively managed investment process that pursues our mission by combining a trend following investment philosophy and a “buy low, sell high” investment strategy. Our mission is to grow our client’s financial wealth over a full market cycle in a risk-managed and tax-efficient way.
We monitor the relationship between price and the Blue Line over time to help identify which stock markets worldwide are experiencing rising, sideways, and declining primary trends. We prefer to invest in those markets experiencing rising or sideways primary trends, while avoiding those markets experiencing declining primary trends. The Blue Line helps us identify these trends, and when changes may be taking place.
The S&P 500 Index is one of the most commonly followed equity indices, and many consider it one of the best representations of the U.S. stock market, and a bellwether for the U.S. economy. It is comprised of 500 large companies having common stock listed on the NYSE or NASDAQ. The volatility (beta) of the account may be greater or less than the index. It is not possible to invest directly in this index.
Technical analysis is a method of evaluating securities by analyzing statistics generated by market activity, such as past prices and volumes. Technical analysis attempts to predict a future stock price or direction based on market trends. The assumption is that the market follows discernible patterns and if these patterns can be identified then a prediction can be made. The risk is that markets may not always follow patterns. There are certain limitations to technical analysis research, such as the calculation results being impacted by changes in security price during periods of market volatility. Technical analysis is one of many indicators that may be used to analyze market data for investing purposes and should not be considered a guaranteed prediction of market activity. The opinions expressed are those of BLI. The opinions referenced are as of the date of publication and are subject to change without notice. BLI reserves the right to modify its current investment strategies based on changing market dynamics or client needs.
Past performance is not indicative of future results. This material is not financial advice or an offer to sell any product. The information contained herein should not be considered a recommendation to purchase or sell any particular security. Forward looking statements cannot be guaranteed.
Guardian Wealth Advisors, LLC (“GWA”) is an investment adviser registered with the U.S. Securities and Exchange Commission. Registration does not imply a certain level of skill or training. More information about GWA’s investment advisory services can be found in its Form ADV Part 2, which is available upon request.
GWA-21-20

