
In last month’s update I referenced skipping rocks on a pond to help illustrate the concept of how stock markets have historically changed from a rising to a declining trend. I believe this concept is important because as someone recently said, “The stock market takes the stairs on the way up, but the elevator on the way down.” To attempt to protect your financial wealth from significant investment loss requires being familiar with the potential warning signs that have historically manifested before the losses occur.
Last month I posed the question, “How can we attempt to identify when the energy is spent to take proactive and protective action with stock investments?” While writing my book, specifically Chapter 6, I came to the realization that the trend channel is a crucial component to recognizing a potential change in trend, in addition to the price of an investment and its individual Blue Line.
For instance, the sharp price decline last year during March did not result in a change in trend. I believe the reason why is because the decline was sharp and quick, rather than subtle and drawn out. Historically speaking, trends do not change on a dime. They tend to change over time as the number of sellers overtake the number of buyers. And during this transition, price drops from one trend channel into the next lower trend channel.
In the chart below I have identified two rising trend channels using dashed orange lines. If these trend channels are drawn correctly, and if history repeats sometime in the future, I would expect price to drop below the orange dashed line labeled “A” to the line labeled “B.” If the trend is changing, price may bounce up and down between those two lines before eventually dropping below the Blue Line, down to line “C.” This process would likely take place over a period of several months or a few quarters.
This pattern of investor behavior played out during the previous stock market tops of 1969, 2000, and 2007. In each of those cases, the stock market lost approximately 50% in value over the subsequent year(s).
CHANNEL Perspective (A Risk Indicator)
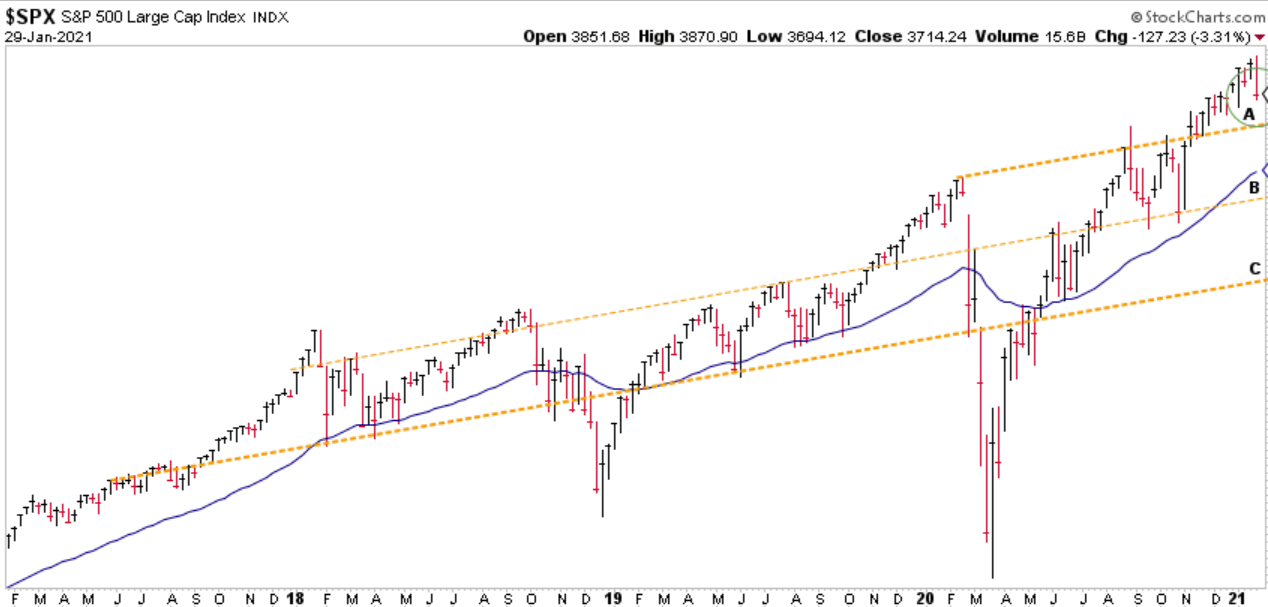
Chart courtesy of StockCharts.com
I believe to have a chance to proactively manage investment risk it is crucial to identify when investment risks are increasing and before they manifest. While there are no guarantees of success, I believe history, and historical patterns of investor behavior, show us what to look for.
BLUE LINE Perspective (A Trend Indicator)
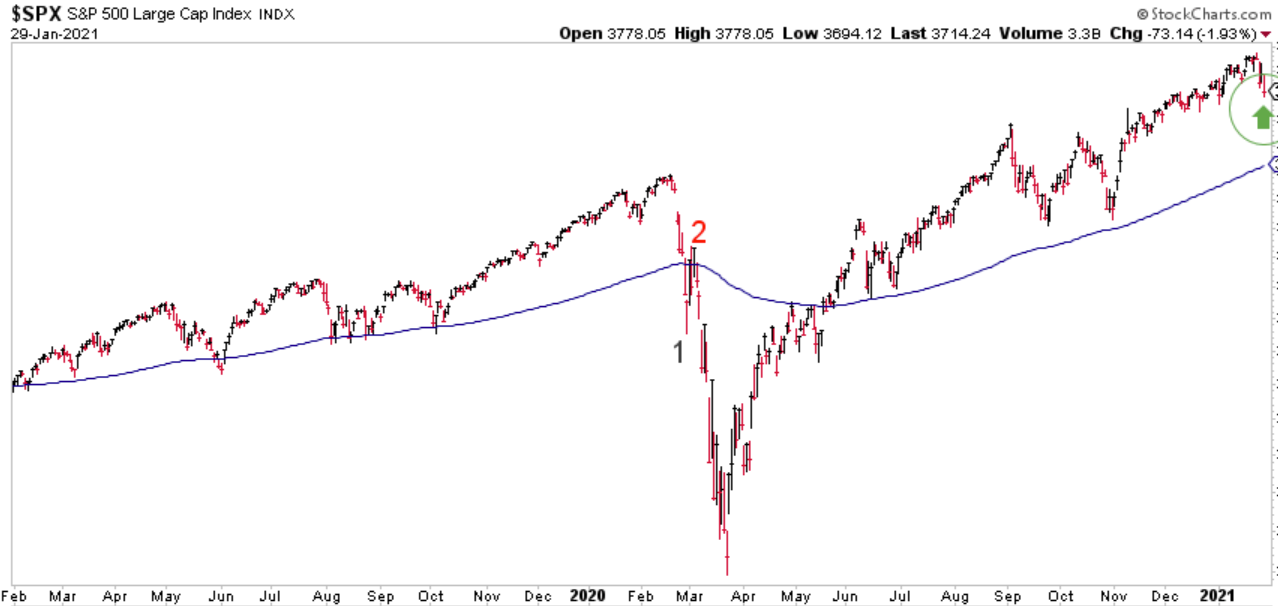
Chart courtesy of StockCharts.com
According to the BLUE LINE INVESTING® process, the current primary trend is defined as a rising trend. The US stock market, as measured by the S&P 500 Index (S&P), finished the month of January 8.4% above the Blue Line, compared to 12.2% above the Blue Line at the end of December (please refer to the green arrow at the far right-hand side of the chart above).
If you know someone who needs help investing their wealth but is worried about of suffering significant investment loss, please invite them to sign up for a complimentary 30-minute phone call by going to BlueLineInvesting.YouCanBook.Me. I am happy to answer their questions and be a resource to help in any way I can.
As a quick reminder, the purpose for providing this monthly update is to illustrate the BLUE LINE INVESTING® process by applying it to the S&P 500 Index. However, this process is applied to all investments held within our strategies. Thank you for reading and please share with anyone you know who may be interested.
Jeff Link
Disclaimers:
BLUE LINE INVESTING® (BLI) is an actively managed investment process that pursues our mission by combining a trend following investment philosophy and a “buy low, sell high” investment strategy. Our mission is to grow our client’s financial wealth over a full market cycle in a risk-managed and tax-efficient way.
We monitor the relationship between price and the Blue Line over time to help identify which stock markets worldwide are experiencing rising, sideways, and declining primary trends. We prefer to invest in those markets experiencing rising or sideways primary trends, while avoiding those markets experiencing declining primary trends. The Blue Line helps us identify these trends, and when changes may be taking place.
The S&P 500 Index is one of the most commonly followed equity indices, and many consider it one of the best representations of the U.S. stock market, and a bellwether for the U.S. economy. It is comprised of 500 large companies having common stock listed on the NYSE or NASDAQ. The volatility (beta) of the account may be greater or less than the index. It is not possible to invest directly in this index.
Technical analysis is a method of evaluating securities by analyzing statistics generated by market activity, such as past prices and volumes. Technical analysis attempts to predict a future stock price or direction based on market trends. The assumption is that the market follows discernible patterns and if these patterns can be identified then a prediction can be made. The risk is that markets may not always follow patterns. There are certain limitations to technical analysis research, such as the calculation results being impacted by changes in security price during periods of market volatility. Technical analysis is one of many indicators that may be used to analyze market data for investing purposes and should not be considered a guaranteed prediction of market activity. The opinions expressed are those of BLI. The opinions referenced are as of the date of publication and are subject to change without notice. BLI reserves the right to modify its current investment strategies based on changing market dynamics or client needs.
Past performance is not indicative of future results. This material is not financial advice or an offer to sell any product. The information contained herein should not be considered a recommendation to purchase or sell any particular security. Forward looking statements cannot be guaranteed.
Guardian Wealth Advisors, LLC (“GWA”) is an investment adviser registered with the U.S. Securities and Exchange Commission. Registration does not imply a certain level of skill or training. More information about GWA’s investment advisory services can be found in its Form ADV Part 2, which is available upon request.
GWA-21-09

