
Happy New Year! This statement seems to have a more significant meaning this year, wouldn’t you agree?
The US stock market, as measured by the S&P 500 Index (S&P), finished the month of December 12.2% above the Blue Line, compared to 11.0% at the end of November. Please refer to the far right-hand side of the chart below. Why do I place so much emphasis on the Blue Line? I’ll share an analogy that came to mind over breakfast this morning.
BLUE LINE Perspective (A Trend Indicator)
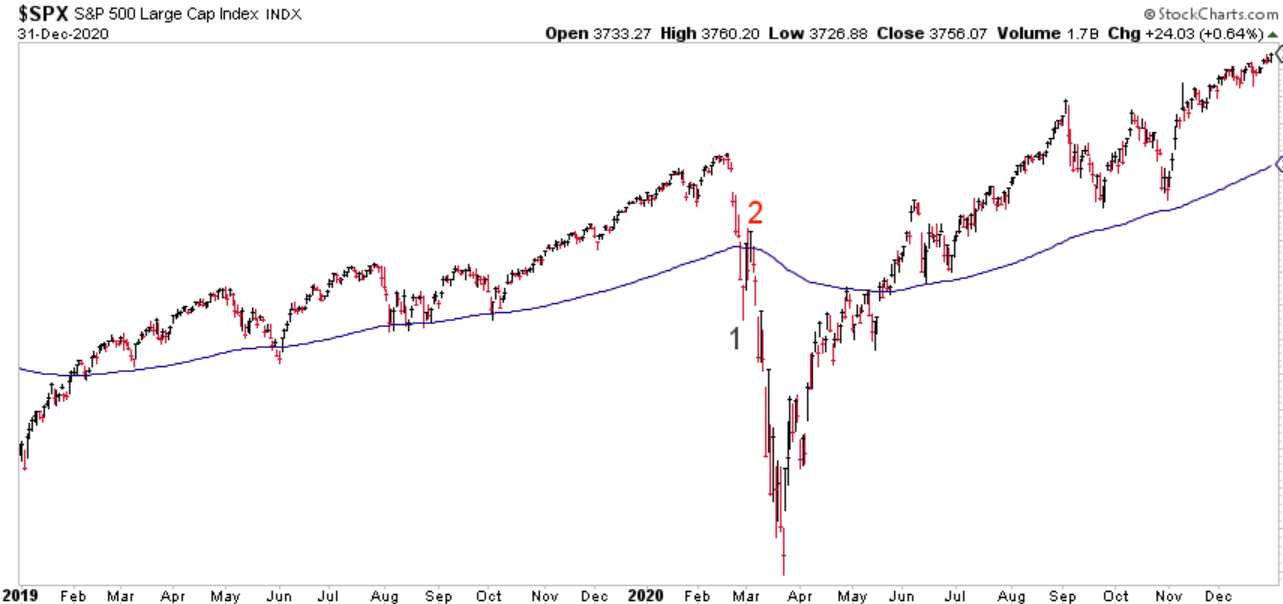
Chart courtesy of StockCharts.com
If you have skipped rocks on a lake or pond sometime during your life, you will recall that the harder you threw the rock the more times it would bounce off the water. As you swung your arm forward you generated a bunch of energy that initially propelled the rock. And when it hits the water the first time it bounces (assuming your throw was successful). If energy exists, it bounced off the water again, and again, and again. But as the energy faded, the bounces become smaller and tend to occur more frequently. When the energy is finally depleted the rock sinks under the water and drops to the bottom.
Using this analogy, the S&P (the “rock”) bounces off the Blue Line (the “water”) as long as energy exists. This contributes to a long-term rising trend.
Why is this important? Because I believe when it comes to investing, it isn’t only how much money you make when markets are rising that matters, but rather, how much you keep when they decline.
So, speaking historically, how can we attempt to identify when the energy is spent to take proactive and protective action with our stock investments? While I was writing my book Protecting the Pig, I discovered and believe that the chart below is crucial to help answer this question.
CHANNEL Perspective (A Risk Indicator)
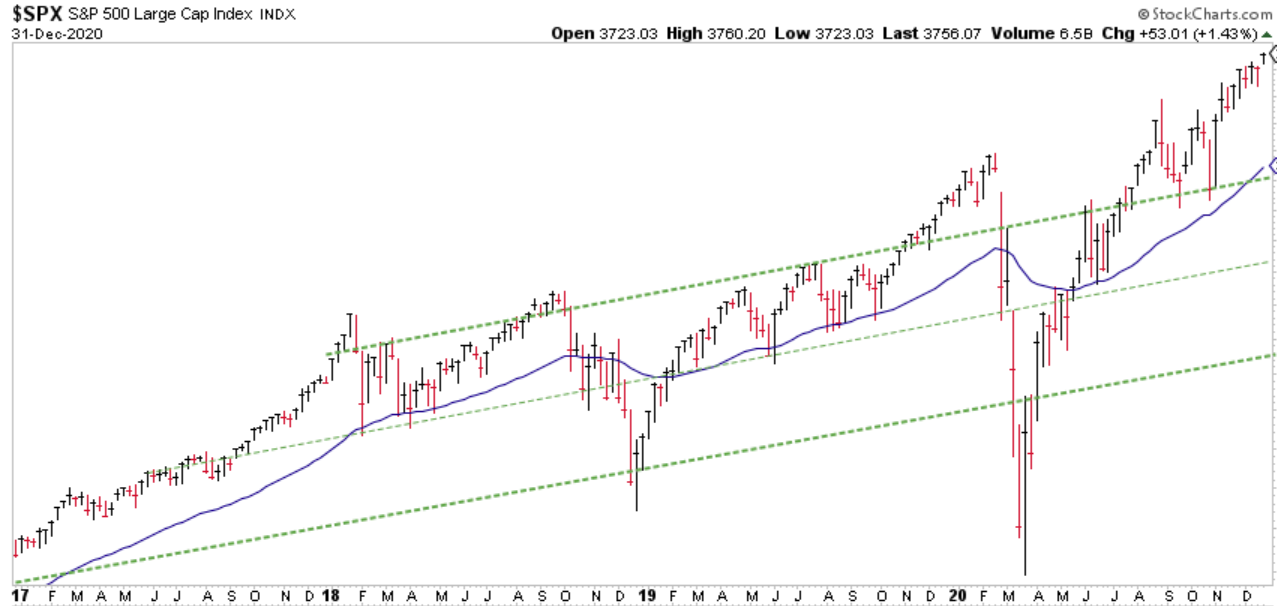
Chart courtesy of StockCharts.com
I’ll share more on this next month, but the concept has been illustrated succinctly in Chapter 6 of my book called “When Selling May Be Your Best Option.”
If you know someone who is worried about the possibility of suffering significant investment loss and isn’t familiar with a sell process, please invite them to send an email to Info@BlueLineInvesting.com. I am happy to offer a complimentary 30-minute call to answer their questions and help how I can.
As a quick reminder, the purpose for providing this monthly update is to illustrate the BLUE LINE INVESTING® process by applying it to the S&P 500 Index. However, this process is applied to all investments held within our strategies.
Jeff Link
Disclaimers:
BLUE LINE INVESTING® (BLI) is an actively managed investment process that pursues our mission by combining a trend following investment philosophy and a “buy low, sell high” investment strategy. Our mission is to grow our client’s financial wealth over a full market cycle in a risk-managed and tax-efficient way.
We monitor the relationship between price and the Blue Line over time to help identify which stock markets worldwide are experiencing rising, sideways, and declining primary trends. We prefer to invest in those markets experiencing rising or sideways primary trends, while avoiding those markets experiencing declining primary trends. The Blue Line helps us identify these trends, and when changes may be taking place.
The S&P 500 Index is one of the most commonly followed equity indices, and many consider it one of the best representations of the U.S. stock market, and a bellwether for the U.S. economy. It is comprised of 500 large companies having common stock listed on the NYSE or NASDAQ. The volatility (beta) of the account may be greater or less than the index. It is not possible to invest directly in this index.
Technical analysis is a method of evaluating securities by analyzing statistics generated by market activity, such as past prices and volumes. Technical analysis attempts to predict a future stock price or direction based on market trends. The assumption is that the market follows discernible patterns and if these patterns can be identified then a prediction can be made. The risk is that markets may not always follow patterns. There are certain limitations to technical analysis research, such as the calculation results being impacted by changes in security price during periods of market volatility. Technical analysis is one of many indicators that may be used to analyze market data for investing purposes and should not be considered a guaranteed prediction of market activity. The opinions expressed are those of BLI. The opinions referenced are as of the date of publication and are subject to change without notice. BLI reserves the right to modify its current investment strategies based on changing market dynamics or client needs.
Past performance is not indicative of future results. This material is not financial advice or an offer to sell any product. The information contained herein should not be considered a recommendation to purchase or sell any particular security. Forward looking statements cannot be guaranteed.
Guardian Wealth Advisors, LLC (“GWA”) is an investment adviser registered with the U.S. Securities and Exchange Commission. Registration does not imply a certain level of skill or training. More information about GWA’s investment advisory services can be found in its Form ADV Part 2, which is available upon request.
GWA-21-01

