
In my April 2022 update I introduced a new potential declining trend channel, identified by two downward sloping red-dashed lines. Over the next three weeks, the S&P broke down through the lower, red-dashed line as the stock market decline continued. Then, during the final week of May the market staged a price rally leaving the S&P down 13.3%* for the year. From top to bottom, the S&P declined 20% for the year through May 20th. The question many people are now asking is, “Was that the bottom?” Currently, I believe the answer is let’s hope so. If it wasn’t, I believe there could be another 20% or so to go before reaching a final bottom somewhere in the months ahead.
PRIMARY TREND: RISING (but correcting)
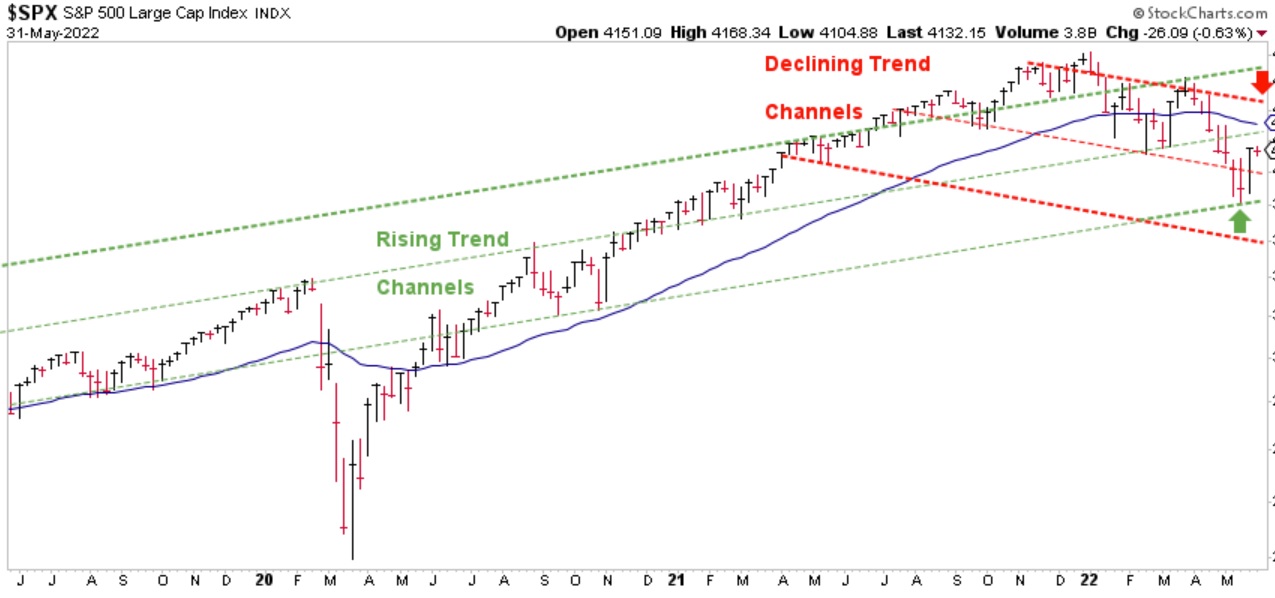
Chart courtesy of StockCharts.com
The chart above illustrates the S&P at a potential intersection of trend channels. The rising trend channels are identified by the green-dashed lines, while the declining trend channels are identified by the red-dashed lines. To attempt to keep this concept as simple as possible, I have added a red arrow and a green arrow to the chart above. If price can eventually rally and break above the top, red-dashed line identified by the red arrow, then I believe it will signal the green rising channel remains dominant and higher prices are likely. However, if price eventually breaks below the lowest green-dashed line identified by the green arrow, I believe continued losses are likely. Please look at the next chart to see why.
THE LINE IN THE SAND?
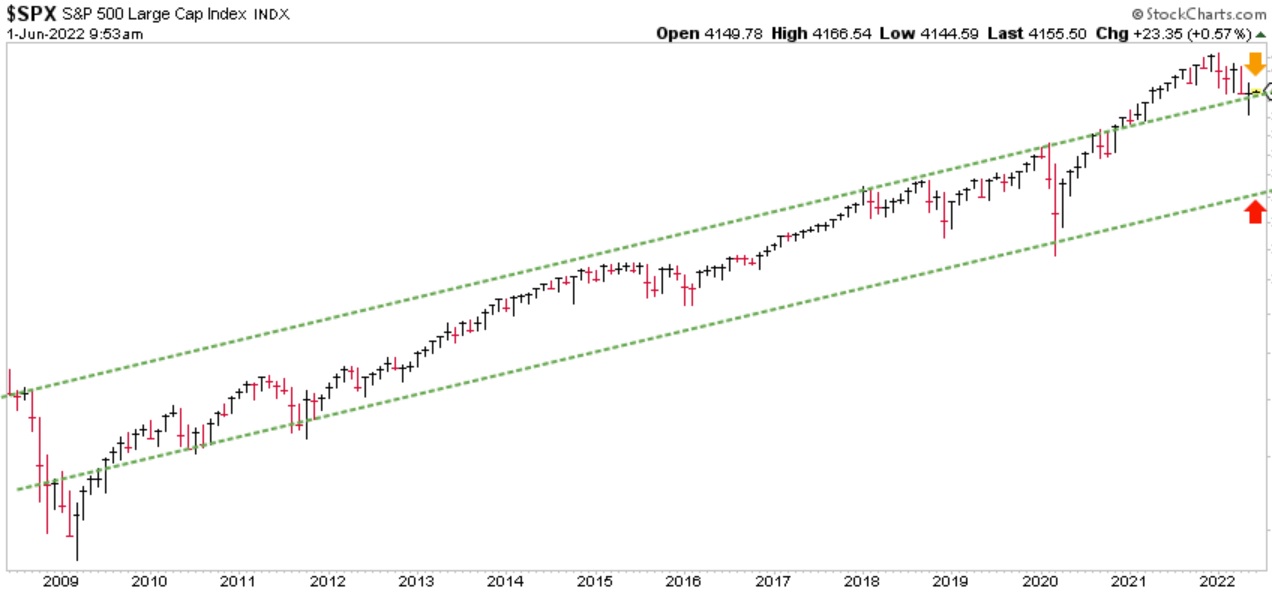
Chart courtesy of StockCharts.com
The chart above shows what I believe are the outside “bounds” of a rising trend channel dating back to 2008. I believe the S&P is currently testing the top, green-dashed line as identified by the orange arrow. IF this line is broken, and remains broken, it opens the door to the possibility of price eventually dropping down to the lower, green-dashed line identified by the red arrow. If this were to eventually happen, total losses on the S&P could approximate 40% from the high to the low. Based on stock market history dating back to the late 1960’s and through the 1970’s, this should not come as a surprise if it were to happen again. I encourage all investors who read these updates and are not existing clients to reevaluate your investment strategy and be prepared for whatever may lie ahead. The longer the S&P remains below the Blue Line, the more likely future losses are in store. Speaking of the Blue Line…
THE “BLUE LINE”: A CLOSER LOOK
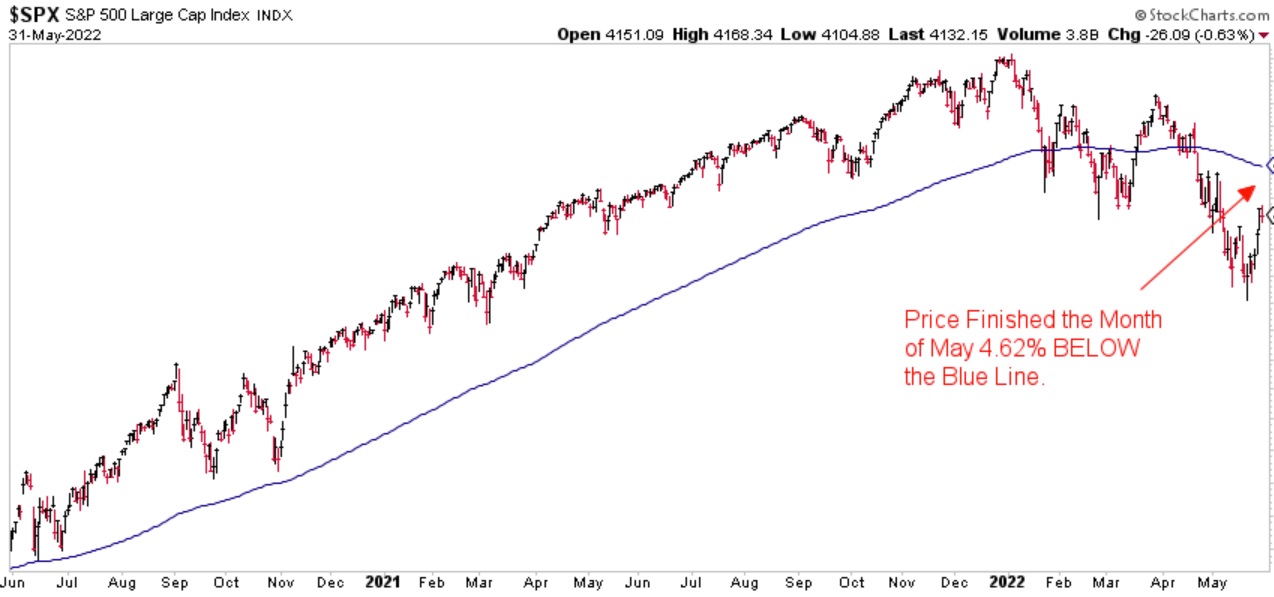
Chart courtesy of StockCharts.com
The S&P finished the month of May 4.62% below the Blue Line, compared to 6.1% below the Blue Line at the end of April.
Thank you for reading this update. I am currently considering changing to a podcast-type format for these updates along with other educational content. If you would prefer to watch a video rather than read these updates, please send an email to Info@BlueLineInvesting.com with the word “video” in the subject line. I appreciate your input.
Jeff Link
Disclaimers:
The BLUE LINE INVESTING® (BLI) investment process was founded on over 95 years of stock market history. It seeks to identify and align investment decisions with multiyear trends. Various aspects of this process have been illustrated in my book Protecting The Pig: How Stock Market Trends Reveal the Way to Grow and Preserve Your Wealth.
The S&P 500 Index is one of the most commonly followed equity indices, and many consider it one of the best representations of the U.S. stock market, and a bellwether for the U.S. economy. It is comprised of 500 large companies having common stock listed on the NYSE or NASDAQ. The volatility (beta) of the account may be greater or less than the index. It is not possible to invest directly in this index.
* www.Slickcharts.com
Technical analysis is a method of evaluating securities by analyzing statistics generated by market activity, such as past prices and volumes. Technical analysis attempts to predict a future stock price or direction based on market trends. The assumption is that the market follows discernible patterns and if these patterns can be identified then a prediction can be made. The risk is that markets may not always follow patterns. There are certain limitations to technical analysis research, such as the calculation results being impacted by changes in security price during periods of market volatility. Technical analysis is one of many indicators that may be used to analyze market data for investing purposes and should not be considered a guaranteed prediction of market activity. The opinions expressed are those of BLI. The opinions referenced are as of the date of publication and are subject to change without notice. BLI reserves the right to modify its current investment strategies based on changing market dynamics or client needs.
Past performance is not indicative of future results. This material is not financial advice or an offer to sell any product. The information contained herein should not be considered a recommendation to purchase or sell any particular security. Forward looking statements cannot be guaranteed.
Guardian Wealth Advisors, LLC (“GWA”) is an investment adviser registered with the U.S. Securities and Exchange Commission. Registration does not imply a certain level of skill or training. More information about GWA’s investment advisory services can be found in its Form CRS or Form ADV Part 2, which is available upon request.
GWA-22-53

