
In last month’s update I pointed out that we are currently in the 16th year of this secular rising stock market. While I expect prices to eventually rise higher into the years ahead as we make our way to a major stock market top, there are a few issues I believe could be cause for short-term concern.
For instance, at the time of this writing, 1 of the 3 major US stock market indices (the Dow Jones Industrial Average) is diverging. While the S&P 500 and NASDAQ have both reached new closing price highs in 2025, the Dow has not. The longer this divergence continues, the probability of experiencing at least a price correction rises.
Also, when we look at the current composition of the S&P 500, the top 10 stocks represent 38% of the entire index, with most of those stocks being in the technology sector. Once again, the S&P is top-heavy. When we update the rising trend from the close of last month, what do we notice?
STOCK MARKET, THE TREND:
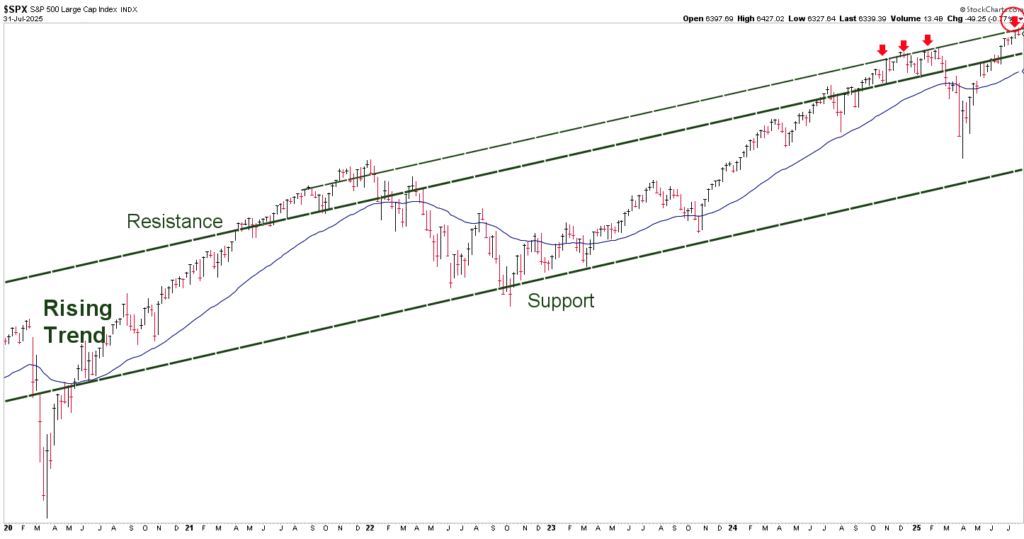
Chart courtesy of StockCharts.com, Data as of 7/31/25
In the top right-hand corner, I have circled the red, downward pointing arrow, showing that once again, we are testing a resistance line that traces back to 2021. By itself this doesn’t mean much. It’s just a reference point that can be useful when evaluating other indicators as I consider future strategic changes within the BLUE LINE INVESTING investment strategies.
As you will see in the following chart, the trajectory of the price rally since the April low is rather steep, and in my opinion, unsustainable. Based on these current observations I find it difficult to justify investing any new money into the market at current prices. For those clients who have added money to their accounts in recent weeks, there’s nothing wrong with collecting a safe return on short-term US Treasury Bills while waiting for a (hopefully) lower stock market price to buy in.
STOCK MARKET, WATCHING FOR THE SUMMIT:
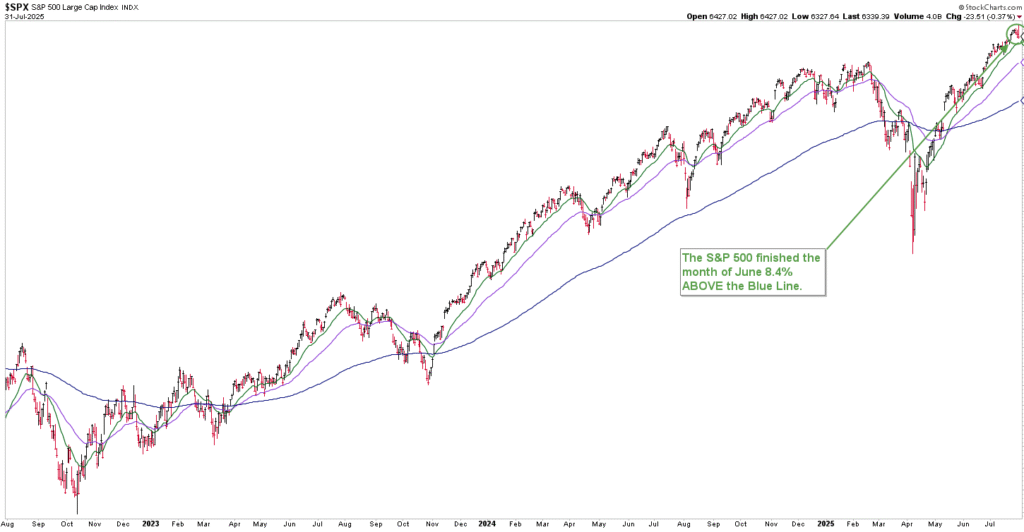
Chart courtesy of StockCharts.com, Data as of 7/31/25
The S&P finished the month of July 8.4% above the Blue Line, compared to 8.1% above the Blue Line at the end of June. For more information on the Blue Line, please refer to Chapter 2 in my book, Protecting The Pig: How Stock Market Trends Reveal the Way to Grow and Preserve your Wealth.
Jeff Link
Disclaimers:
The BLUE LINE INVESTING® (BLI) investment process was founded on over 95 years of stock market history. It seeks to identify and align investment decisions with multiyear trends. Various aspects of this process have been illustrated in my book Protecting The Pig: How Stock Market Trends Reveal the Way to Grow and Preserve Your Wealth.
The S&P 500 Index is one of the most commonly followed equity indices, and many consider it one of the best representations of the U.S. stock market, and a bellwether for the U.S. economy. It is comprised of 500 large companies having common stock listed on the NYSE or NASDAQ. The volatility (beta) of the account may be greater or less than the index. It is not possible to invest directly in this index.
Technical analysis is a method of evaluating securities by analyzing statistics generated by market activity, such as past prices and volumes. Technical analysis attempts to predict a future stock price or direction based on market trends. The assumption is that the market follows discernible patterns and if these patterns can be identified then a prediction can be made. The risk is that markets may not always follow patterns. There are certain limitations to technical analysis research, such as the calculation results being impacted by changes in security price during periods of market volatility. Technical analysis is one of many indicators that may be used to analyze market data for investing purposes and should not be considered a guaranteed prediction of market activity. The opinions expressed are those of BLI. The opinions referenced are as of the date of publication and are subject to change without notice. BLI reserves the right to modify its current investment strategies based on changing market dynamics or client needs.
Past performance is not indicative of future results. This material is not financial advice or an offer to sell any product. The information contained herein should not be considered a recommendation to purchase or sell any particular security. Forward-looking statements cannot be guaranteed.
Investment advisory services offered through Guardian Wealth Advisors, LLC D/B/A Blue Line Investing. Guardian Wealth Advisors, LLC (“GWA”) is an investment adviser registered with the U.S. Securities and Exchange Commission. Registration does not imply a certain level of skill or training. More information about GWA’s investment advisory services can be found in its Form CRS or Form ADV Part 2, which is available upon request.
GWA-25-78


