
In last month’s update I shared my belief that investors should rarely make investment strategy decisions based on their age. Instead, they should make investment decisions based on the prevailing trend of the market. I believe this should be a universal principle followed by every investor. After all, there are times when 65-year-olds should invest like 25-year-olds, and 30-year-olds should invest like 70-year-olds.
For many years the US stock market has been experiencing a secular bull market. Dictionary.com defines the word secular as:
- Economics – (of a fluctuation or trend) occurring or persisting over an indefinitely long period.
The current US stock market certainly meets this definition. In fact, we just passed the midpoint of the 16th year of this current rising trend. I find this fascinating because I became a licensed Financial Advisor in late 1997, which coincided with the 16th year of the prior secular bull market. I’ll never forget what happened after the market topped in the 18th year (1999). For the next 3 years the market lost over 50% of its price. If history repeats in the years ahead, there are at least 3 warning signs investors should be watching for as the stock market reaches its final high. In this update I’ll share 1 of the 3.
When the US stock market eventually reaches its final high, one of the historical warning signs should be that many stocks should already be down 20% or more from their recent price highs. These losses should coincide with the 3 major US stock markets still near or at their all-time highs. The best way to explain this is using investor behavior.
Major institutions like pensions and endowments are not like everyday investors. They cannot sell all their stock holdings with one click of a computer button. It could take them weeks or months to reduce their risk through stock sales. When they begin doing this, they typically sell their least desired stocks first, because they tend to be ones most people aren’t paying much attention to. Historically, people are paying attention to the highfliers that are receiving all the media attention at that time. While the average investor pays attention to the news headlines, the institutions are quietly selling other investments under the radar during the euphoria that tends to accompany new all-time stock market highs. By the time they have reduced their holdings to their desired level, and once the top arrives, the buying dries up. That’s when prices tend to begin declining, and then continue declining over the following months, quarters, and sometimes years.
This behavior tends to be reflected in the charts, which is why I provide this trend update at the end of every month. This institutional (and investor) behavior is what I believe investors should be constantly monitoring and watching.
STOCK MARKET, THE TREND:
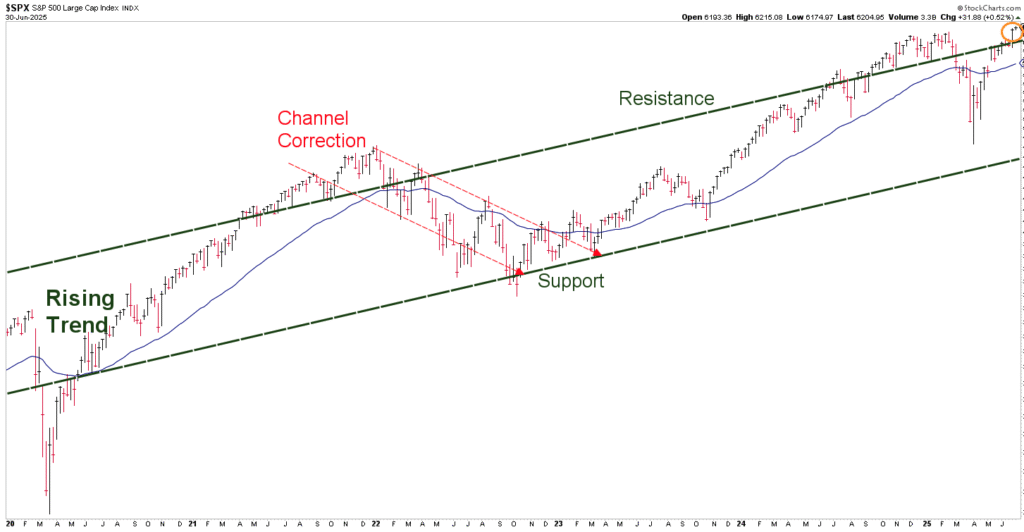
Chart courtesy of StockCharts.com, Data as of 6/30/25
In the top right-hand corner of the chart above I have highlighted the recent “breakout” of price for the S&P 500 Index back above the top, green-dashed line. Watching how this index “behaves” in relation to the rest of the stock market can help identify when to “hedge high” according to our “buy low, hedge high” investment strategy. While we cannot guarantee it will be successful every time, the “buy low(er)” part of our strategy implemented in early April of this year is playing out well so far.
STOCK MARKET, WATCHING FOR THE SUMMIT:
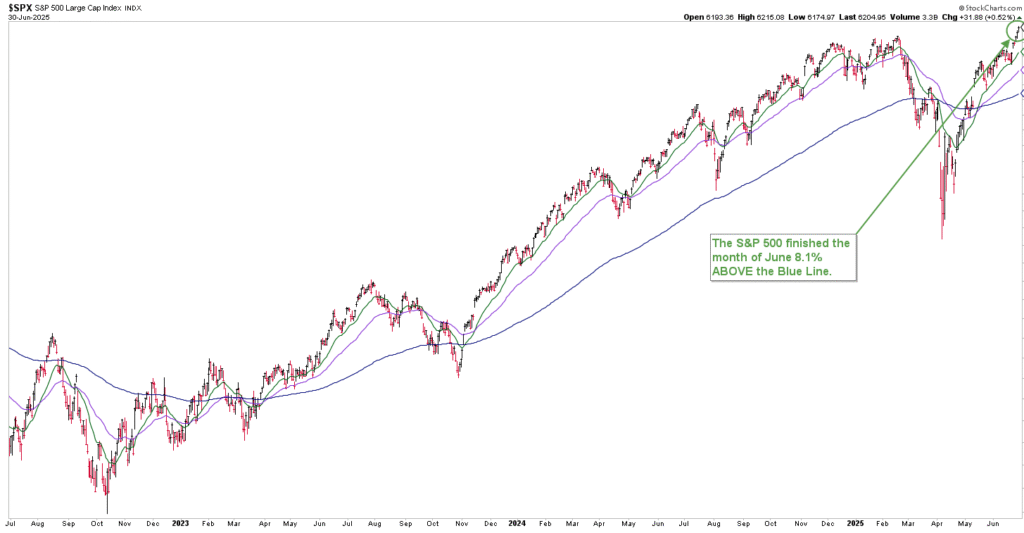
Chart courtesy of StockCharts.com, Data as of 6/30/25
The S&P finished the month of June 8.1% above the Blue Line, compared to 4.2% above the Blue Line at the end of May. While I currently expect prices to pull back in the short-term, the BLUE LINE INVESTINGÒ investment process does not suggest much reason for worry. At least not while price remains above the Blue Line!
Jeff Link
Disclaimers:
The BLUE LINE INVESTING® (BLI) investment process was founded on over 95 years of stock market history. It seeks to identify and align investment decisions with multiyear trends. Various aspects of this process have been illustrated in my book Protecting The Pig: How Stock Market Trends Reveal the Way to Grow and Preserve Your Wealth.
The S&P 500 Index is one of the most commonly followed equity indices, and many consider it one of the best representations of the U.S. stock market, and a bellwether for the U.S. economy. It is comprised of 500 large companies having common stock listed on the NYSE or NASDAQ. The volatility (beta) of the account may be greater or less than the index. It is not possible to invest directly in this index.
Technical analysis is a method of evaluating securities by analyzing statistics generated by market activity, such as past prices and volumes. Technical analysis attempts to predict a future stock price or direction based on market trends. The assumption is that the market follows discernible patterns and if these patterns can be identified then a prediction can be made. The risk is that markets may not always follow patterns. There are certain limitations to technical analysis research, such as the calculation results being impacted by changes in security price during periods of market volatility. Technical analysis is one of many indicators that may be used to analyze market data for investing purposes and should not be considered a guaranteed prediction of market activity. The opinions expressed are those of BLI. The opinions referenced are as of the date of publication and are subject to change without notice. BLI reserves the right to modify its current investment strategies based on changing market dynamics or client needs.
Past performance is not indicative of future results. This material is not financial advice or an offer to sell any product. The information contained herein should not be considered a recommendation to purchase or sell any particular security. Forward-looking statements cannot be guaranteed.
Guardian Wealth Advisors, LLC (“GWA”) is an investment adviser registered with the U.S. Securities and Exchange Commission. Registration does not imply a certain level of skill or training. More information about GWA’s investment advisory services can be found in its Form CRS or Form ADV Part 2, which is available upon request.
GWA-25-65


