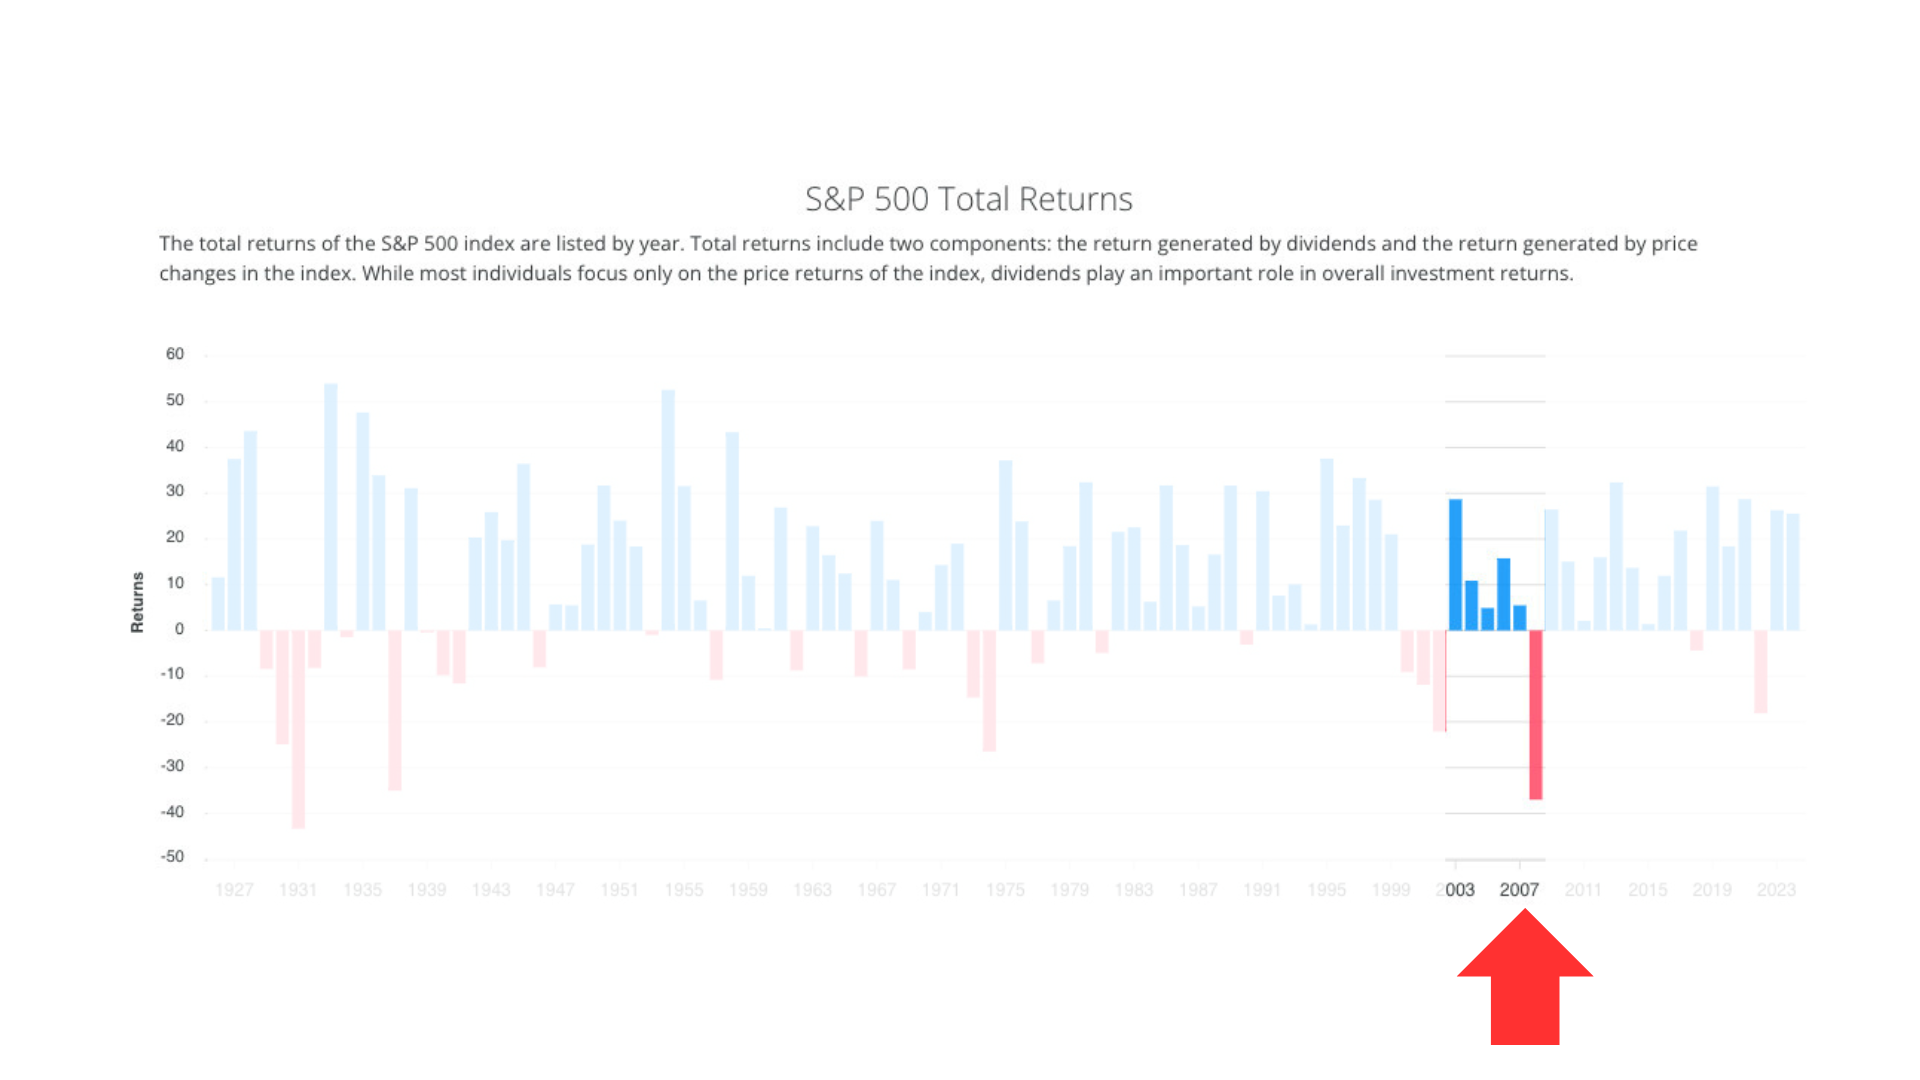
Over the past five articles, we followed more than a century of market history in search of one recurring warning–something the major declines had in common before the greatest damage was done. Time and again, that warning came from the Blue Line.
But recognizing a historical pattern is only useful if we can understand what it may be telling us in real time. Oddly enough, one of the simplest ways to picture it came to me while watching an episode of Discovery’s Gold Rush. The show follows mining crews using enormous machines to separate small amounts of gold from mountains of dirt and rock. In one episode, a long conveyor belt carried that material steadily upward before dropping it onto a pile below.
Watching it, I immediately thought of the stock market.
Gold Rush excavator conveyor belt invention
The pertinent portion of the 3 minute clip is found from the 1:37 – 1:44 minute mark.
The conveyor belt is symbolic of a long-term rising trend. The dirt and rocks moving upward are symbolic of the stocks being carried higher with it. While the material remains on the belt, it continues to rise. But every conveyor belt eventually ends. The dirt and rocks do not fall because the machine necessarily failed. They fall because they reached the point where the support beneath them ended.
Long-term market trends can behave in much the same way. When markets rise for years, it can feel as though the conveyor belt will keep running forever. Account values grow. Retirement plans begin to feel more secure. Confidence replaces caution. But the longer the rise continues, the more important one question becomes:
How can we recognize when a long-term rising trend may be approaching its end?
That is one of the purposes of the Blue Line. It gives us a visual way to monitor whether the long-term trend supporting the market remains intact–or whether evidence of meaningful change is beginning to develop.
Historical Example #1 (1968)
For approximately twenty years, the S&P 500 traveled along a long-term rising trend. Then, in roughly one-tenth of that time, it fell from approximately 104 to below 70–a decline of about 33%.
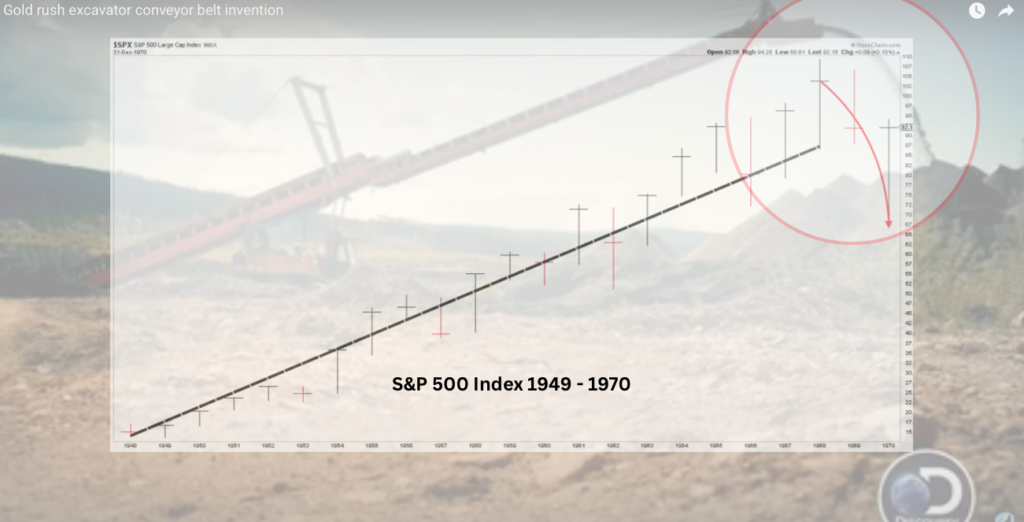
Chart courtesy of StockCharts.com as of December 31, 1970
Historical Example #2 (2000)
Three decades later, investors experienced a remarkably similar pattern. For nineteen years, the market’s conveyor belt carried stocks steadily higher. After the trend ended, the S&P 500 fell from nearly 1,470 to below 770–a decline of approximately 48%.
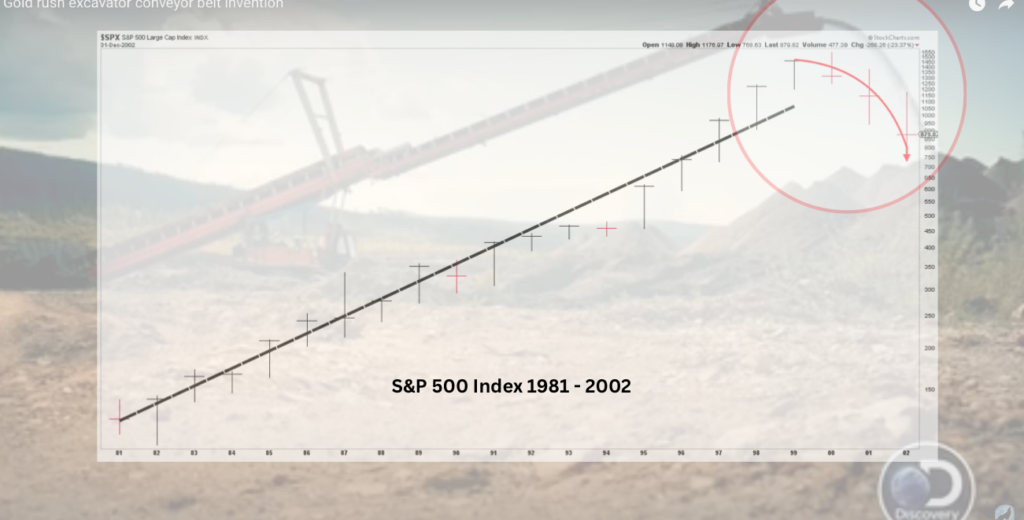
Chart courtesy of StockCharts.com as of December 31, 2002
The dates were different. The economies were different. Even the investors were from different generations. But the experience was painfully familiar: years of progress were followed by steep losses–and years spent trying to recover money that had already been earned.
A 33% decline costs money. A 48% decline costs even more. But for someone approaching retirement, the cost cannot always be measured in dollars.
It may mean postponing retirement. Spending less. Returning to work. Or waiting years just to recover the money that had already been earned.
A portfolio may eventually recover. Lost time does not.
Today’s market
This brings us to the present.
The S&P 500 remains within the long-term rising trend that began nearly eighteen years ago. As of the end of July, the market and its conveyor belt looked like this:
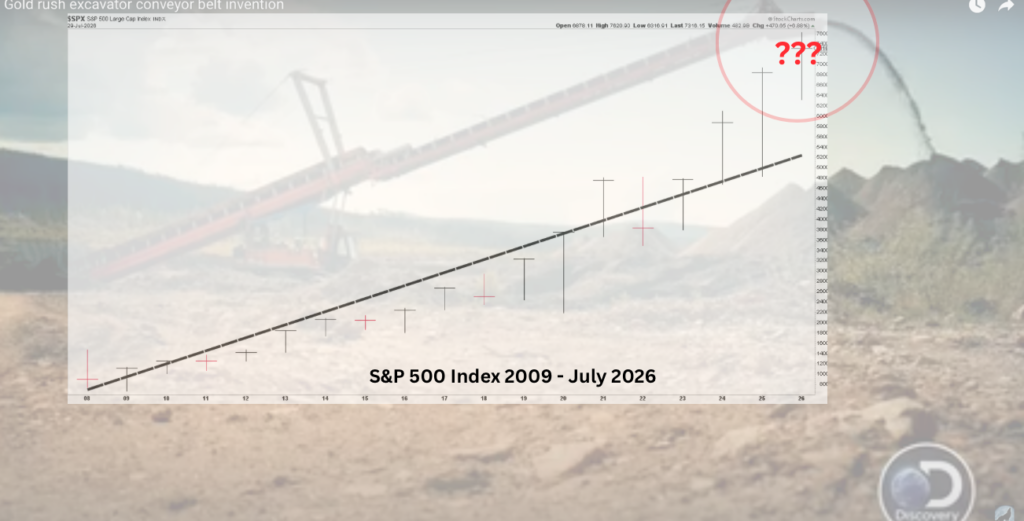
Chart courtesy of StockCharts.com as of July 31, 2026
No one knows precisely when today’s long-term trend will end. The Blue Line cannot provide an exact date, and that is not its purpose.
One of its purposes is to help us recognize when the evidence suggests that the market’s underlying support may be changing–while there may still be time to respond thoughtfully rather than emotionally. History reminds us that no rising trend continues forever.
The question is not whether the conveyor belt will eventually end.
The question is how many investors will recognize the change before their money begins falling from it?
Where We Stand as of Month’s End
The historical lesson gives us perspective. The current evidence tells us what, if anything, we should do with it.
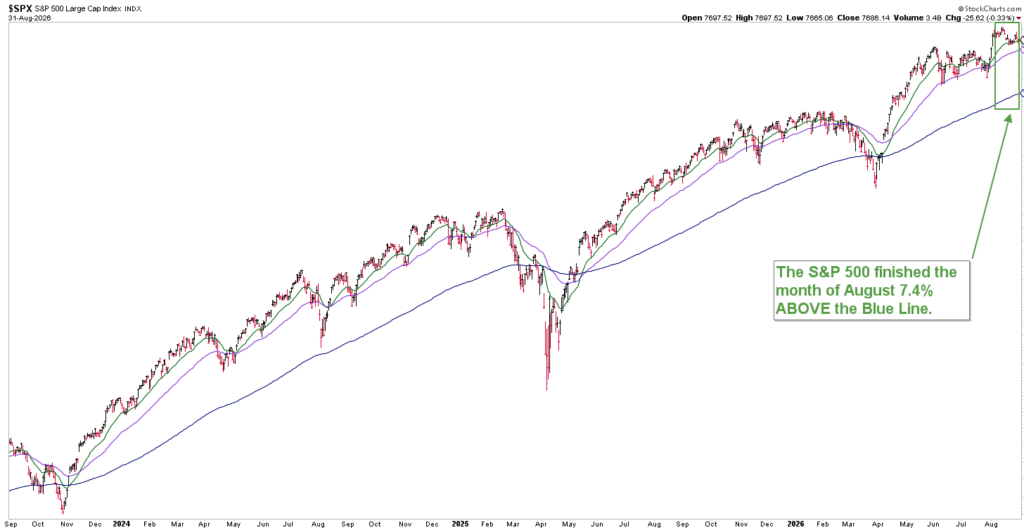
Chart courtesy of StockCharts.com, Data as of 8/31/26
As of the end of August:
- The S&P 500 finished the month 7.4% above the Blue Line
- One month earlier, it stood 6.5% above the Blue Line
Markets will always fluctuate. Headlines will always compete for our attention. Our responsibility is to look beyond the daily emotion, study the evidence, and make disciplined decisions based on condition of the long-term trend.
To our clients, thank you for trusting us to serve as your advocate. If you are not yet a client, we welcome the opportunity to show you how the Blue Line Investing process seeks to participate in rising markets, respond as the evidence of risk develops, and help prevent a major market decline from becoming a life-changing financial loss.
Participate. Protect. Prosper.
Jeff Link
Founder
(833) 258-2583
Disclaimers:
The BLUE LINE INVESTING® (BLI) investment process was founded on over 95 years of stock market history. It seeks to identify and align investment decisions with multiyear trends. Various aspects of this process have been illustrated in my book Protecting The Pig: How Stock Market Trends Reveal the Way to Grow and Preserve Your Wealth.
The S&P 500 Index is one of the most commonly followed equity indices, and many consider it one of the best representations of the U.S. stock market, and a bellwether for the U.S. economy. It is comprised of 500 large companies having common stock listed on the NYSE or NASDAQ. The volatility (beta) of the account may be greater or less than the index. It is not possible to invest directly in this index.
Technical analysis is a method of evaluating securities by analyzing statistics generated by market activity, such as past prices and volumes. Technical analysis attempts to predict a future stock price or direction based on market trends. The assumption is that the market follows discernible patterns and if these patterns can be identified then a prediction can be made. The risk is that markets may not always follow patterns. There are certain limitations to technical analysis research, such as the calculation results being impacted by changes in security price during periods of market volatility. Technical analysis is one of many indicators that may be used to analyze market data for investing purposes and should not be considered a guaranteed prediction of market activity. The opinions expressed are those of BLI. The opinions referenced are as of the date of publication and are subject to change without notice. BLI reserves the right to modify its current investment strategies based on changing market dynamics or client needs.
Past performance is not indicative of future results. This material is not financial advice or an offer to sell any product. The information contained herein should not be considered a recommendation to purchase or sell any particular security. Forward-looking statements cannot be guaranteed.
Investment advisory services offered through Guardian Wealth Advisors, LLC D/B/A Blue Line Investing. Guardian Wealth Advisors, LLC (“GWA”) is an investment adviser registered with the U.S. Securities and Exchange Commission. Registration does not imply a certain level of skill or training. More information about GWA’s investment advisory services can be found in its Form CRS or Form ADV Part 2, which is available upon request.
GWA-26-74