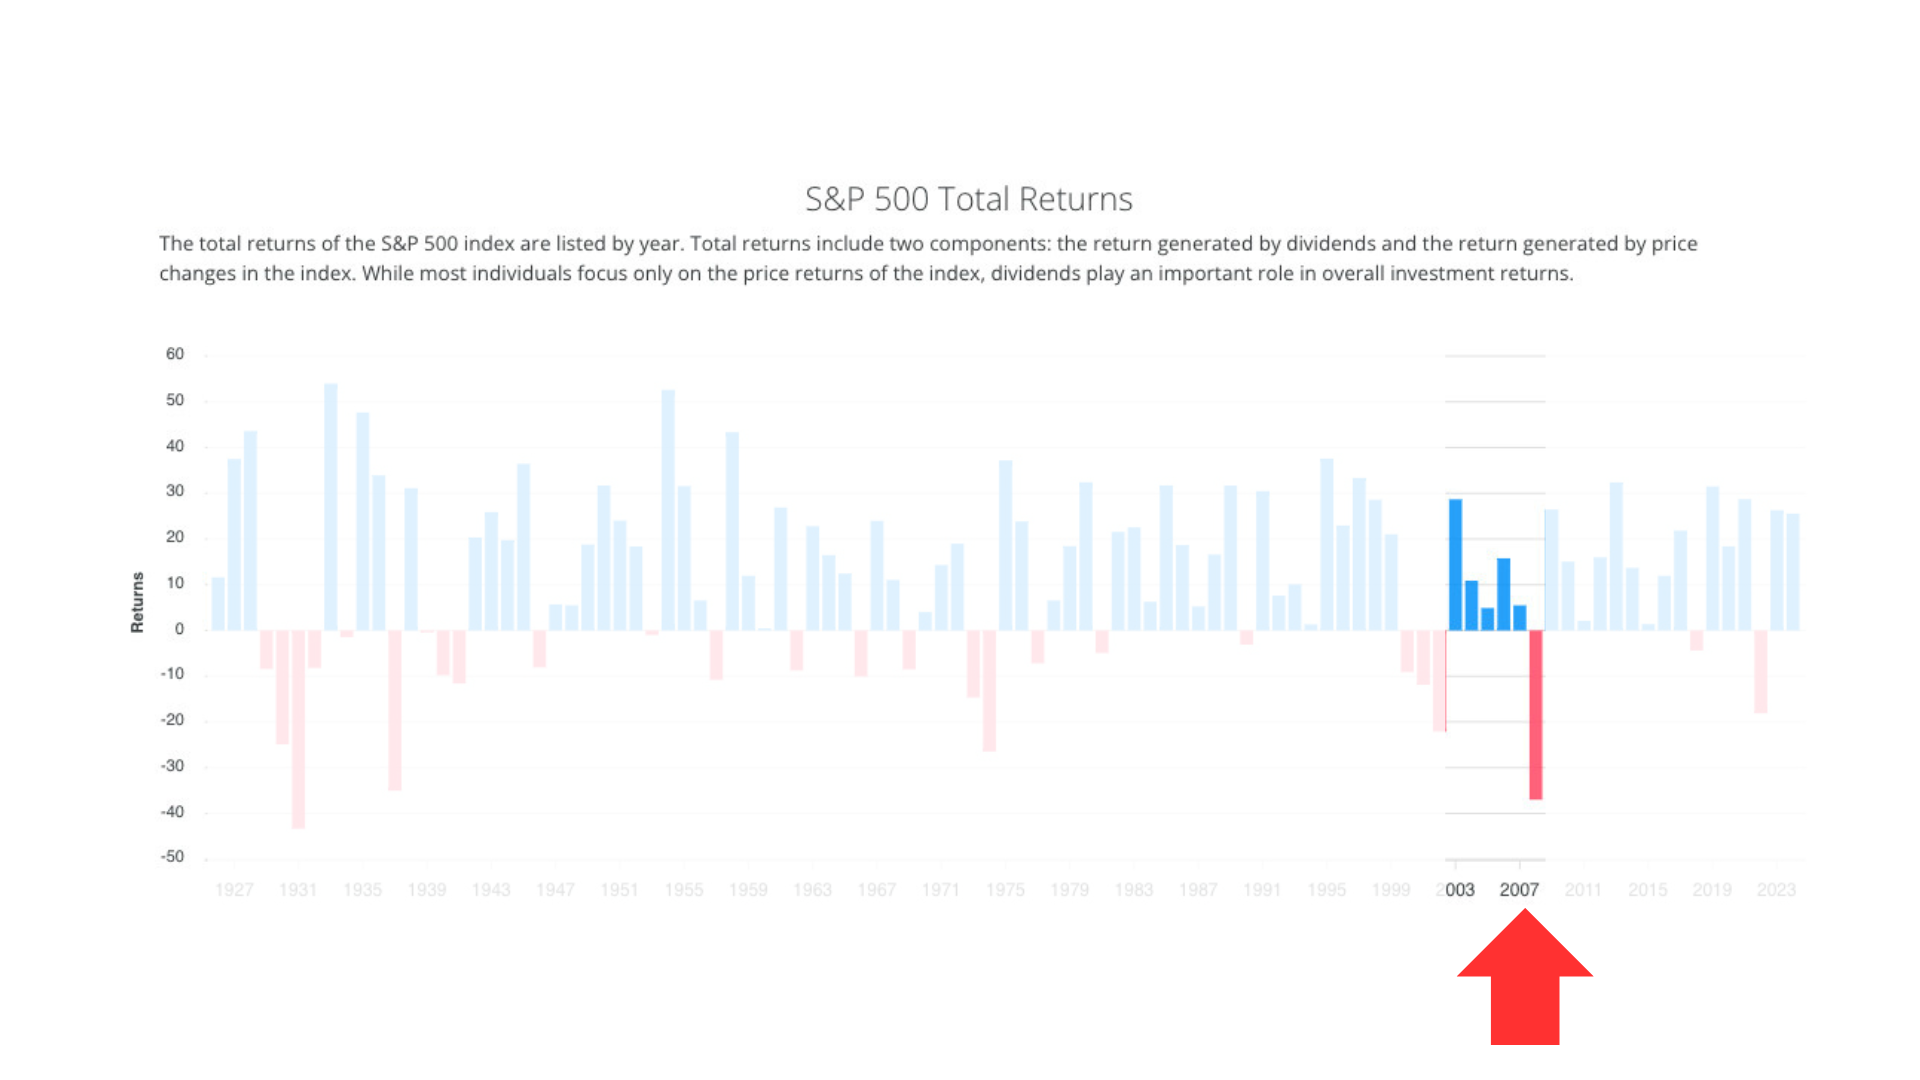
In Part 2 of this series I posed a simple yet profound question:
Can investing decisions really be this simple?
I believe the answer is a definitive yes. To explain why, let me take you back to a childhood activity many of us remember–Color by Number.
As children, we learned two important lessons from those pages: first, association (i.e. “1 = blue, 2 = green), and second, attention to detail (staying within the lines). By following a few simple instructions, a plain black-and-white page gradually transformed into a complete picture filled with color.
One reason Color by Number was enjoyable is that it removed complexity. There were no calculations, no opinions, no headlines, and no emotions competing for your attention. You simply followed the process.
Shouldn’t investing work the same way?
A Quick Recap
In Parts 1 and 2, we examined two of the most significant stock market declines of the past century–the Great Depression and World War II. If you haven’t read them yet, you can find them here and here.
Now let’s move to our third historical example.
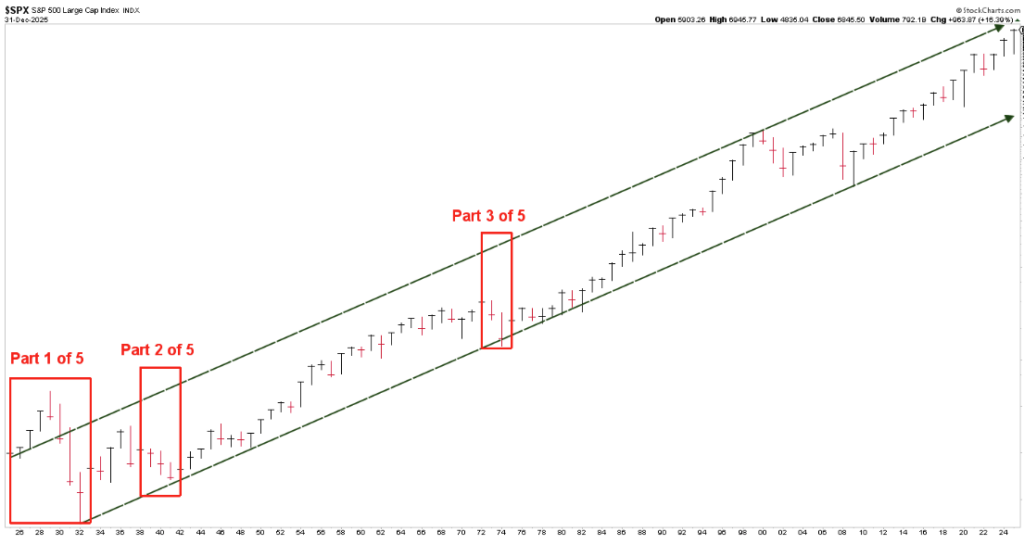
Chart courtesy of StockCharts.com, Data as of 12/31/25
Our Third Historical Example – The 1970’s Energy Crisis
The decade began on a positive note for investors.
- Market returns for 1970, 1971 and 1972 were +4.0%, +14.3%, and +19.0%
- During this period, prices remained predominately above the Blue Line.
Then something changed.
In early 1973, the market began signaling that conditions were deteriorating. Prices quickly fell below the Blue Line and, for the most part, remained there. (Refer to the red arrows)
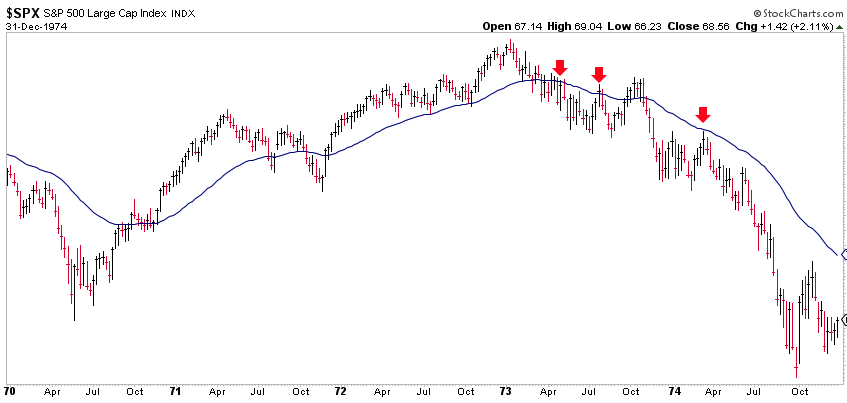
Chart courtesy of StockCharts.com, Data as of 12/31/1974
The Blue Line, which had previously acted as a floor on price corrections transformed into a ceiling on price rallies. And by October 1973, the reason became clear. Several Arab oil-producing nations imposed an oil embargo on the United States. Oil prices quadrupled within months, gasoline shortages emerged, and energy costs surged across the economy.
Yet notice something important.
The market’s behavior changed long before the headlines fully explained why. As the chart illustrates, price action had already begun communicating a message through its relationship with the Blue Line.
- Market returns for 1973 and 1974 were -14.7% and -26.5%
- During this period, prices remained predominately below the Blue Line.
For the “average” investor, these losses accumulated quickly. For passive investors who simply bought and held through the downturn, the cost was not limited to money. They also lost something equally valuable: time.
Key Takeaway
After reviewing our third of five historical downturns, consider the question once again:
Can investing decisions really be this simple?
I hope the answer is becoming increasingly clear. In many cases, investors experience significant losses not because they lacked opportunity, but because they lacked a process. Too often, investors–or the professionals they rely upon–ride the market all the way up, only to ride it all the way back down again.
Losses will always be part of investing. No strategy can eliminate them entirely. What investors can influence, however, is the magnitude of those losses. And that ultimately comes down to the investment strategy they choose to follow.
I believe Warren Buffett said it best when he said:
The first rule of an investment is don’t lose.
And the second rule of an investment is don’t forget the first rule.
And that’s all the rules there are.
Where We Stand as of Month’s End
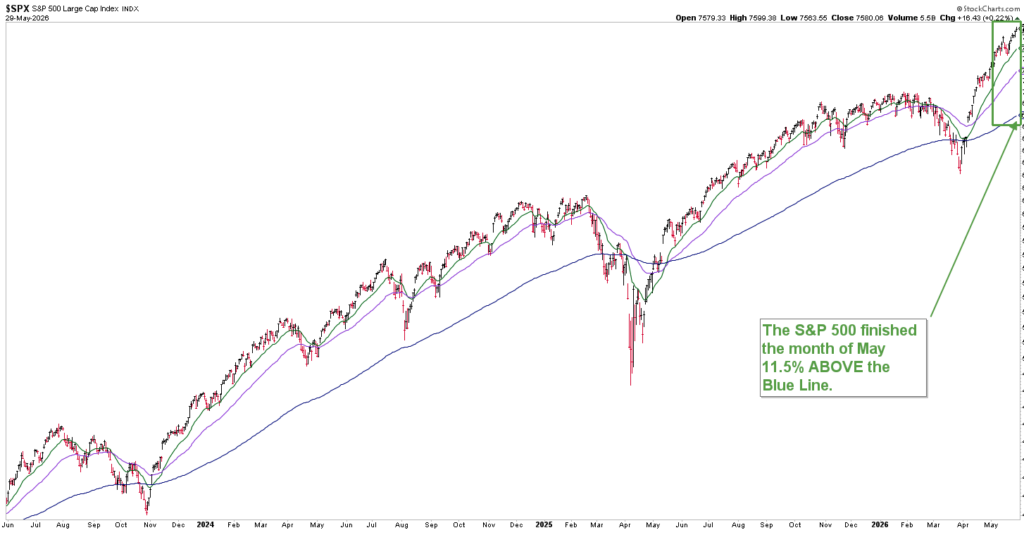
Chart courtesy of StockCharts.com, Data as of 5/31/26
As of the end of May:
- The S&P 500 finished the month 11.5% above the Blue Line
- One month earlier, it stood 8.2% above the Blue Line
For those between the ages of 50 and 65, the next market decline isn’t just another headline–it has the potential to impact years of planning, saving, and preparation. The closer retirement gets, the less time there is to recover from significant losses. Now is the time to ask an important question:
Does your current investment strategy have a plan for protecting what you’ve spent decades building?
If you are not a current client and would like to understand how market trends may affect your future, let’s talk.
Jeff Link
Founder
(833) 258-2583
Disclaimers:
The BLUE LINE INVESTING® (BLI) investment process was founded on over 95 years of stock market history. It seeks to identify and align investment decisions with multiyear trends. Various aspects of this process have been illustrated in my book Protecting The Pig: How Stock Market Trends Reveal the Way to Grow and Preserve Your Wealth.
The S&P 500 Index is one of the most commonly followed equity indices, and many consider it one of the best representations of the U.S. stock market, and a bellwether for the U.S. economy. It is comprised of 500 large companies having common stock listed on the NYSE or NASDAQ. The volatility (beta) of the account may be greater or less than the index. It is not possible to invest directly in this index.
Technical analysis is a method of evaluating securities by analyzing statistics generated by market activity, such as past prices and volumes. Technical analysis attempts to predict a future stock price or direction based on market trends. The assumption is that the market follows discernible patterns and if these patterns can be identified then a prediction can be made. The risk is that markets may not always follow patterns. There are certain limitations to technical analysis research, such as the calculation results being impacted by changes in security price during periods of market volatility. Technical analysis is one of many indicators that may be used to analyze market data for investing purposes and should not be considered a guaranteed prediction of market activity. The opinions expressed are those of BLI. The opinions referenced are as of the date of publication and are subject to change without notice. BLI reserves the right to modify its current investment strategies based on changing market dynamics or client needs.
Past performance is not indicative of future results. This material is not financial advice or an offer to sell any product. The information contained herein should not be considered a recommendation to purchase or sell any particular security. Forward-looking statements cannot be guaranteed.
Investment advisory services offered through Guardian Wealth Advisors, LLC D/B/A Blue Line Investing. Guardian Wealth Advisors, LLC (“GWA”) is an investment adviser registered with the U.S. Securities and Exchange Commission. Registration does not imply a certain level of skill or training. More information about GWA’s investment advisory services can be found in its Form CRS or Form ADV Part 2, which is available upon request.
GWA-26-47