Most investors have heard the old investment saying: Buy Low, Sell High. It sounds simple. Most investors would probably say they believe it.
So why do so few investors do it?
Over the past four months, we’ve examined four of the five largest stock market declines of the past century, searching for one factor they all shared. So far, every historical example has pointed to the same conclusion. Now we come to our fifth–and final–example. Will the pattern finally break, or will history repeat itself once again?
A Quick Recap
In Parts 1 through 4 we examined market declines associated with the Great Depression, World War II, the 1970s energy crisis, and the Dot-Com Bubble. The circumstances surrounding each were remarkably different, yet beneath those differences the market displayed a remarkably similar pattern before the largest losses unfolded.
That brings us to our final historical example–one many investors experienced firsthand.
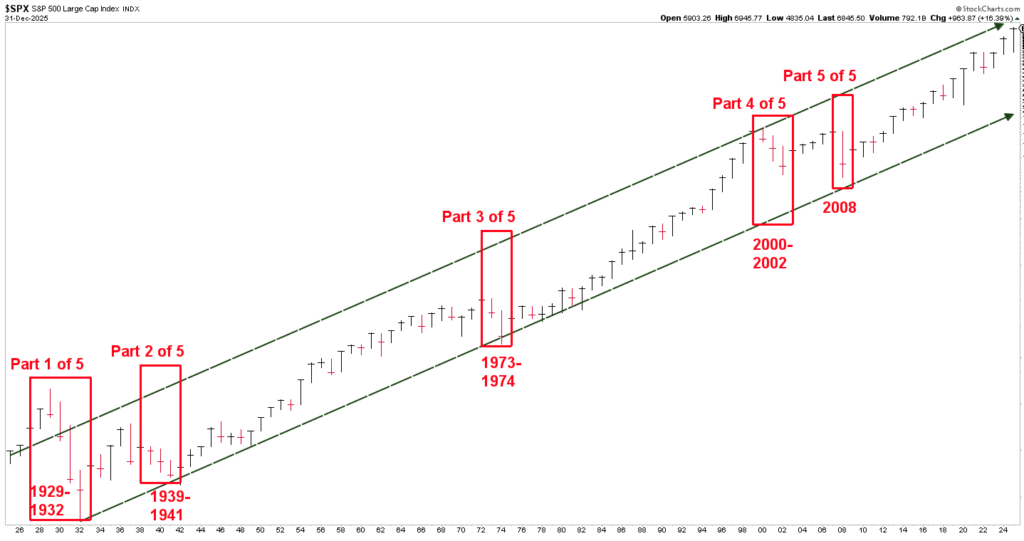
Chart courtesy of StockCharts.com, Data as of 12/31/25
Our Fifth Historical Example – The 2008 Housing and Financial Crisis
Following the 2000-2002 decline, stocks entered another strong advance. Between 2003 and 2007, the S&P 500 gained +28.68%, +10.88%, +4.91%, 15.79%, and +5.49% (65% cumulatively). Five consecutive years of gains can make rising markets begin to feel almost permanent.
They aren’t.
As investor confidence continued to grow, serious problems were quietly building beneath the surface of the housing market and financial system. Few recognized how significant they would become. Yet by late 2007, the market itself had already begun telling a different story.
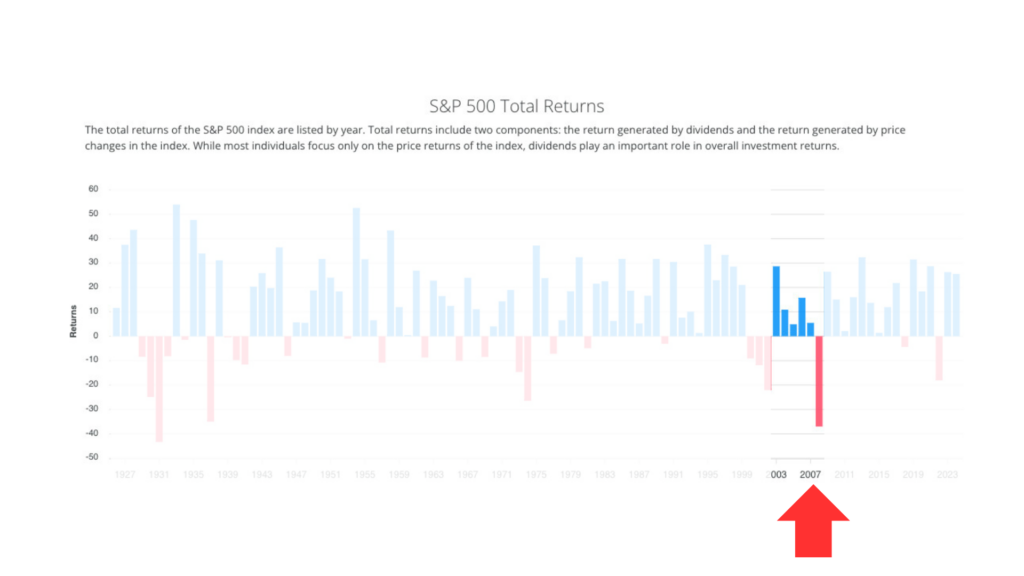
Chart courtesy of SlickCharts.com
During calendar year 2008 alone, the S&P 500 declined 37%. Investors lost more than money. Many also lost time–years waiting to get back to where they started. For those approaching retirement, that lost time mattered just as much as the decline itself. So rather than focus on the headlines, let’s examine what the market was doing.
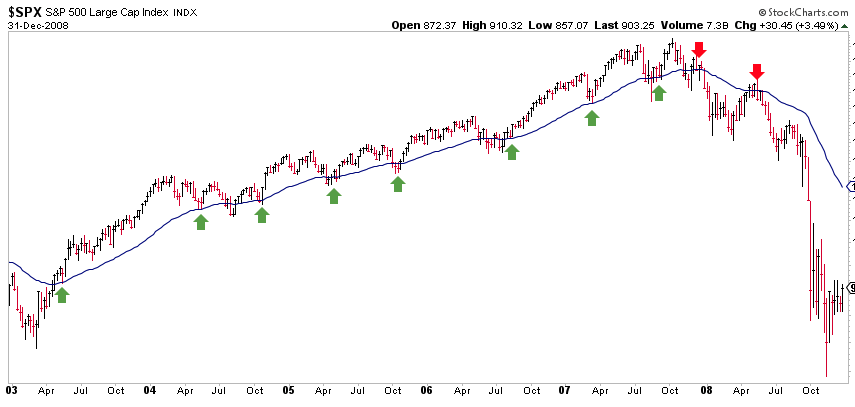
Chart courtesy of StockCharts.com, Data as of 12/31/2008
The Pattern Repeats
Throughout the five-year advance, prices repeatedly found support at the Blue Line before moving to new highs. The green arrows identify several of those occasions. During these periods, the Blue Line acted much like a floor beneath the market.
Then something changed.
After the market peaked, prices fell below the Blue Line. Subsequent rallies struggled to regain their previous strength, and what had acted as support increasingly became resistance. The red arrows identify this transition.
Temporary declines occur during every long-term advance. But what is most important is attempting to identify when what began as an initial temporary decline becomes something more. Once again, our fifth historical example followed the same basic pattern we observed in the previous four. Five different crises. Five different causes. Yet the market communicated the same warning each time.
Five Historical Examples
Four different decades.
Five different causes.
Five different economic environments.
Yet all five shared one remarkable characteristic. Each began with years of rising prices that eventually changed into meaningful declines. And in every case, the market itself began revealing that change before the largest losses had fully unfolded.
Where We Stand as of Month’s End
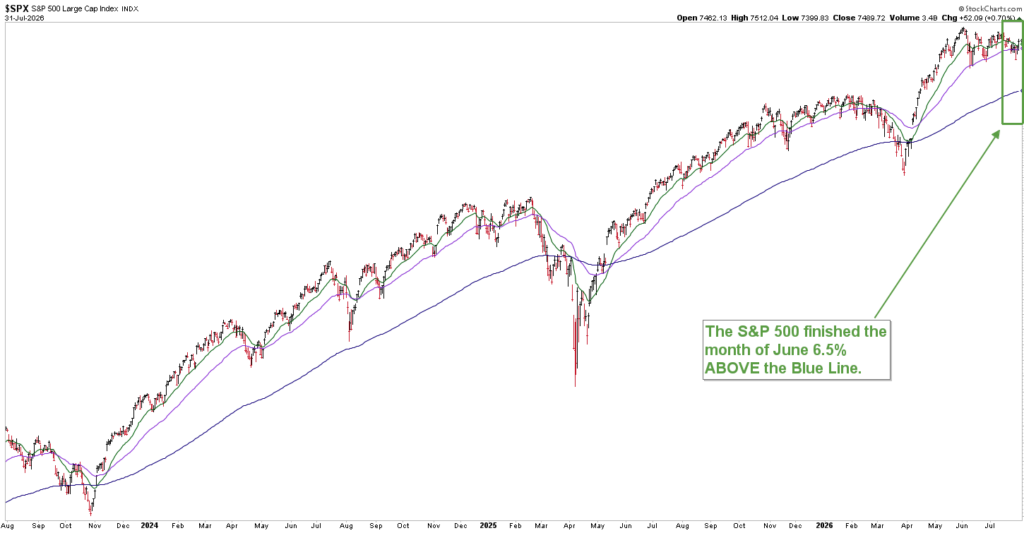 Chart courtesy of StockCharts.com, Data as of 7/31/26
As of the end of July:
- The S&P 500 finished the month 6.5% above the Blue Line
- One month earlier, it stood 8.4% above the Blue Line
Markets will always fluctuate. Headlines will always compete for your attention. Our responsibility is to look beyond emotion, study the evidence, and make disciplined investment decisions based on historical market trends.
To our clients, thank you for trusting us to be your advocate. If you’re not yet a client, we’d welcome the opportunity to show you how our disciplined investment process seeks to help investors participate in long-term market growth while working to protect against life-changing losses.
Participate. Protect. Prosper.
Jeff Link
Founder
(833) 258-2583
Disclaimers:
The BLUE LINE INVESTING® (BLI) investment process was founded on over 95 years of stock market history. It seeks to identify and align investment decisions with multiyear trends. Various aspects of this process have been illustrated in my book Protecting The Pig: How Stock Market Trends Reveal the Way to Grow and Preserve Your Wealth.
The S&P 500 Index is one of the most commonly followed equity indices, and many consider it one of the best representations of the U.S. stock market, and a bellwether for the U.S. economy. It is comprised of 500 large companies having common stock listed on the NYSE or NASDAQ. The volatility (beta) of the account may be greater or less than the index. It is not possible to invest directly in this index.
Technical analysis is a method of evaluating securities by analyzing statistics generated by market activity, such as past prices and volumes. Technical analysis attempts to predict a future stock price or direction based on market trends. The assumption is that the market follows discernible patterns and if these patterns can be identified then a prediction can be made. The risk is that markets may not always follow patterns. There are certain limitations to technical analysis research, such as the calculation results being impacted by changes in security price during periods of market volatility. Technical analysis is one of many indicators that may be used to analyze market data for investing purposes and should not be considered a guaranteed prediction of market activity. The opinions expressed are those of BLI. The opinions referenced are as of the date of publication and are subject to change without notice. BLI reserves the right to modify its current investment strategies based on changing market dynamics or client needs.
Past performance is not indicative of future results. This material is not financial advice or an offer to sell any product. The information contained herein should not be considered a recommendation to purchase or sell any particular security. Forward-looking statements cannot be guaranteed.
Investment advisory services offered through Guardian Wealth Advisors, LLC D/B/A Blue Line Investing. Guardian Wealth Advisors, LLC (“GWA”) is an investment adviser registered with the U.S. Securities and Exchange Commission. Registration does not imply a certain level of skill or training. More information about GWA’s investment advisory services can be found in its Form CRS or Form ADV Part 2, which is available upon request.
GWA-26-69