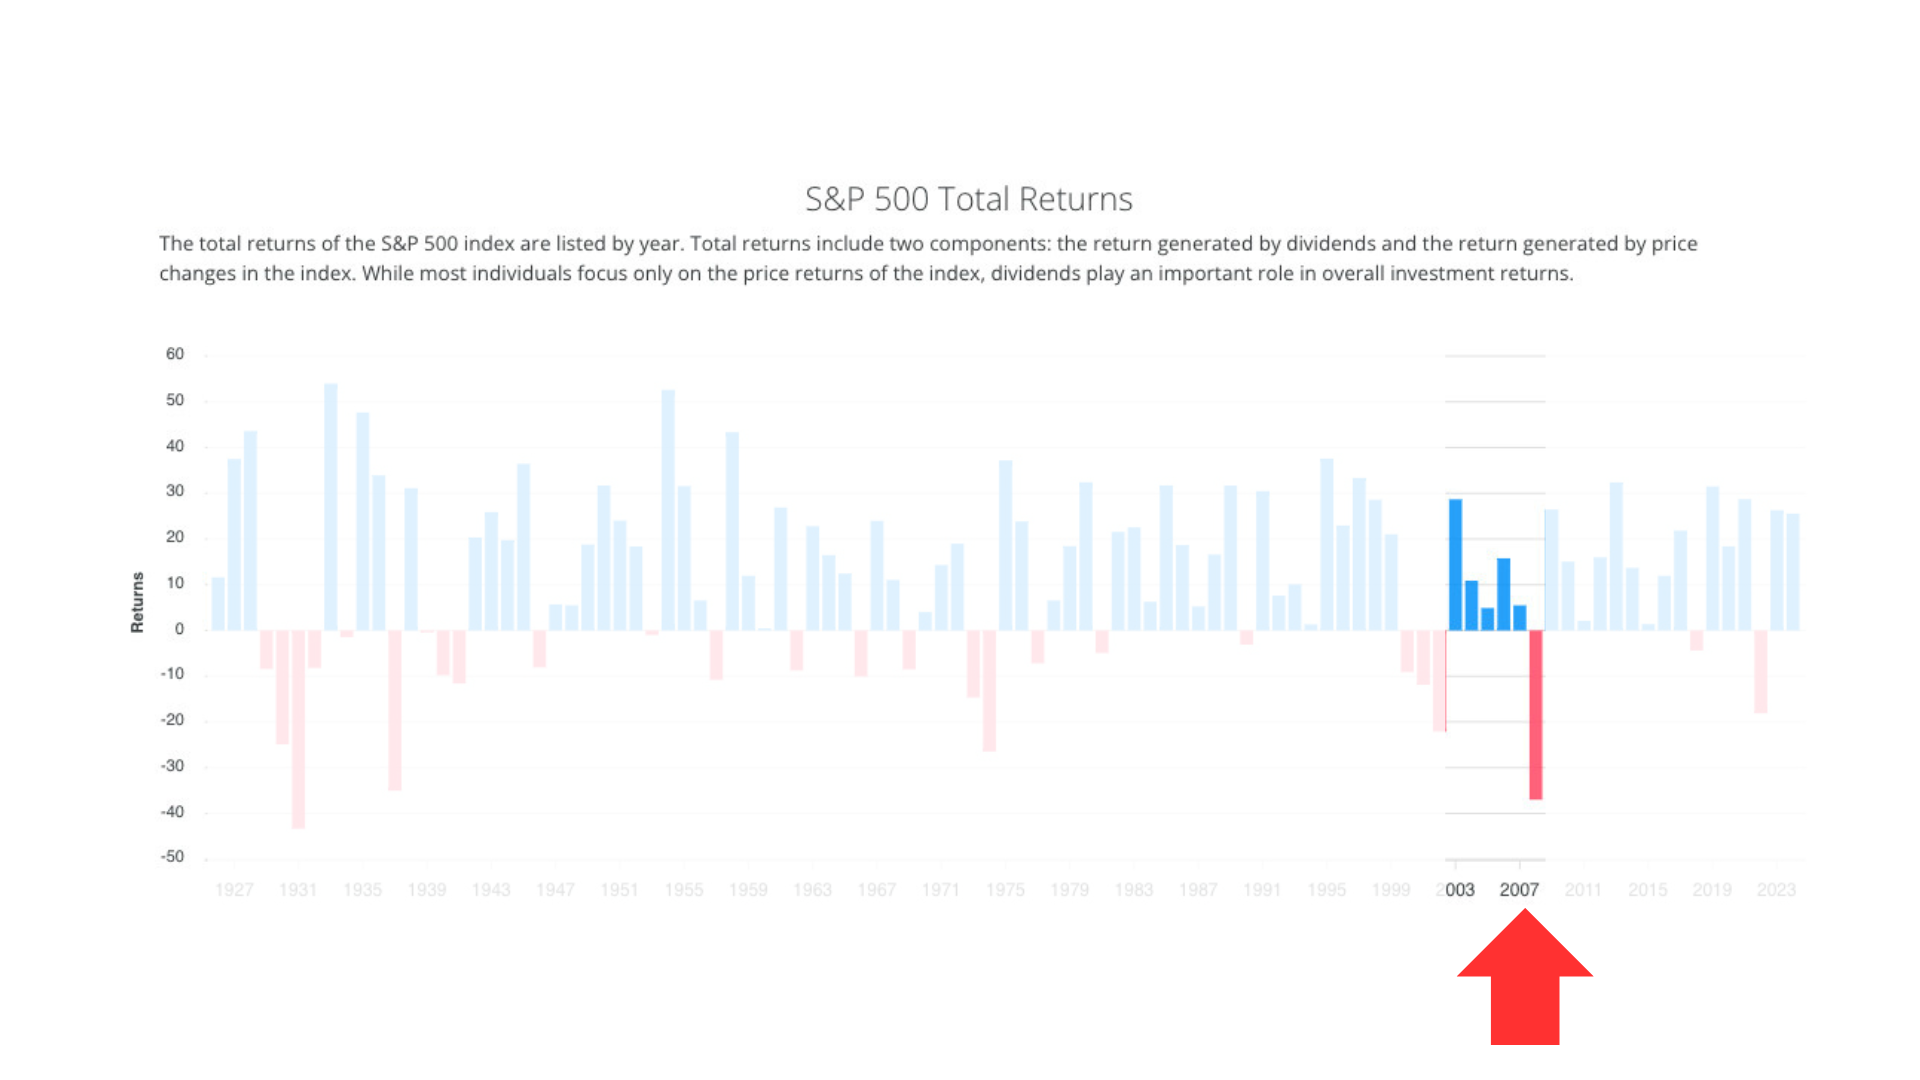
At the conclusion of Part 3 of this series I shared Warren Buffett’s two rules:
The first rule of an investment is don’t lose.
And the second rule of an investment is don’t forget the first rule.
And that’s all the rules there are.
I believe every investor should embrace these two rules because they shift the focus from simply participating in returns to protecting the wealth they’ve already worked so hard to build. And by the end of this article, I will help you understand why this is so important for people who are taking Required Minimum Distributions. But first, let’s do a quick recap.
A Quick Recap
In Parts 1, 2 and 3, we examined the stock market declines that coincided with the Great Depression, World War II, and the 1970’s energy crisis. The greatest lesson we have learned is that even though the outside factor responsible for each of those major declines differed, they all shared something in common. If you haven’t read them yet, you can find them [here], [here], and [here].
Now let’s move to our fourth historical example.
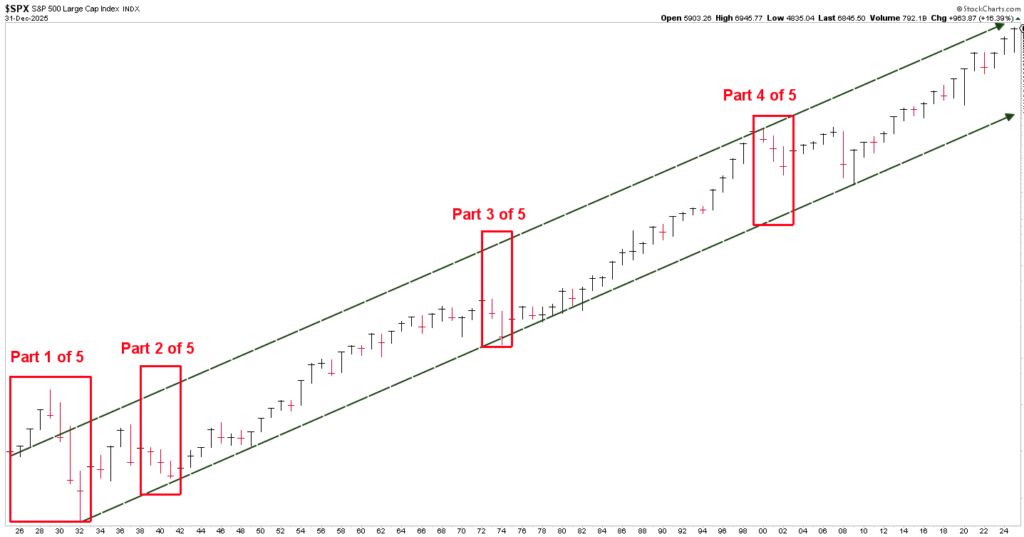
Chart courtesy of StockCharts.com, Data as of 12/31/25
Our Fourth Historical Example – The 2000 Stock Market Top
Like the prior examples, the years that preceded the stock market decline were exceptional. In fact, the S&P 500 Index doubled over the five years heading into the stock market top. These years are identified by the five blue bars in the chart below.
- Market returns for 1995-1999 were +37.61%, +23.0%, +33.4%, 28.6%, and +21.0%
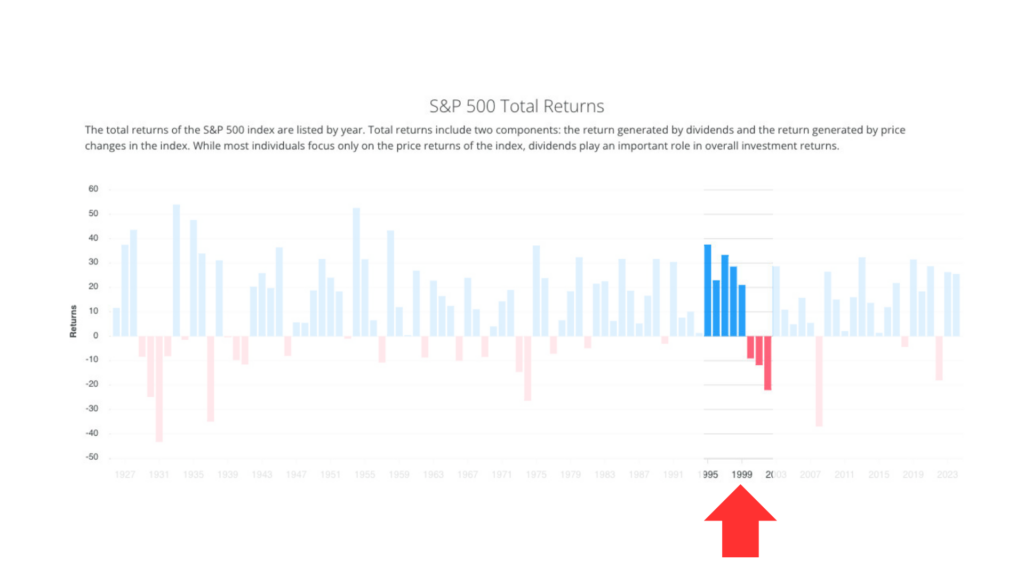
Chart courtesy of SlickCharts.com
At the time, few investors expected the trend to reverse. Yet history reminds us that even the strongest advances eventually give way to meaningful declines (the red bars).
- Market returns for 2000, 2001 and 2002 were -9.1%, -11.9%, and -22.1%
As I have written before, we must change our perspective to see the change in trend happening in real time instead of hearing about it in the media after the fact. This is where the Blue Line can be invaluable. Historically, it has been the one absolute factor that can help identify the timing when a trend is changing from positive to negative. Like the prior historical examples, we can see this clearly in the S&P 500 Index below.
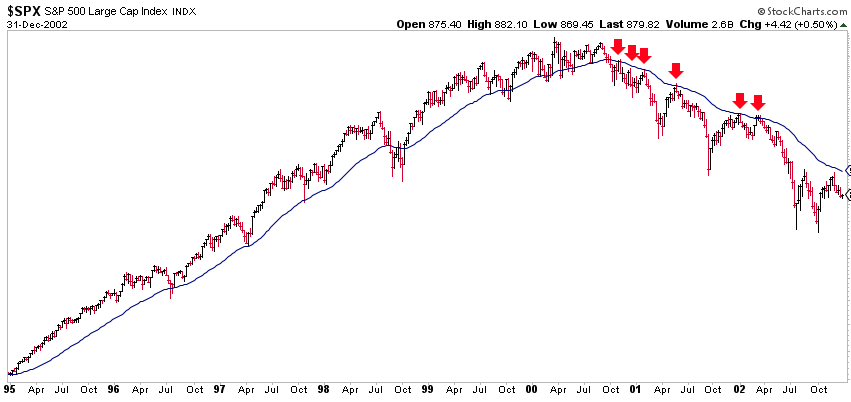
Chart courtesy of StockCharts.com, Data as of 12/31/2002
During the five advancing years, prices remained predominately above the Blue Line. Once the market shifted below the Blue Line, however, the environment changed. As in our prior examples, once price declined below and remained below the Blue Line (see red arrows), investment losses replaced prior gains. Let’s consider how this relationship can prove helpful for people who are taking RMDs.
What is an RMD?
An RMD is a Required Minimum Distribution and is applicable to investors who have reached an age where the government requires them to take a minimum distribution each year from their pre-tax retirement accounts. Whether the income is needed or not, the IRS requires these annual distributions. The question isn’t whether someone will take an RMD–it’s when.
While it can be processed anytime during the calendar year, it must be fully distributed by December 31st. Failure to do so could result in additional taxes and penalties. For investors who are forced to take an RMD, I believe there is a preferable time during the year, and I believe the Blue Line can help provide the timing for when to do so.
For someone taking their RMDs during these years, could there be a way to attempt to identify the best time to process them? Of course, I believe the answer is a resounding–yes! As long as price remains above the Blue Line, investors have considerable flexibility. Whether an RMD is taken in January or December it is unlikely to make a meaningful difference as long as the prevailing trend remains positive.
In declining markets, however, when price is trending below the Blue Line, waiting until late in the year to satisfy an RMD could mean selling investments after substantial losses had already occurred. Under such conditions, it would be more favorable to take the distribution early in the year.
Key Takeaway
After reviewing our fourth of five major historical downturns, a consistent pattern continues to emerge. While no investment strategy can eliminate uncertainty, history demonstrates that knowledge and understanding of long-term market trends can provide valuable guidance. In each example, the Blue Line could have helped distinguish between periods when investors had greater flexibility and periods to make certain investment decisions, and when they needed to become very intentional about such decisions. As it specifically pertains to taking an RMD, investors may benefit from allowing the market’s prevailing trend to play a role rather than relying on the calendar alone to dictate such decisions.
In the Bible, Jesus invited people to “Follow me.”
When it comes to investing, our message is likewise simple: Follow the Blue Line.
Sometimes the greatest investment decision isn’t what you own–it’s when you choose to act. For investors required to take annual distributions, timing can become another tool for preserving wealth rather than simply satisfying a tax requirement.
Where We Stand as of Month’s End
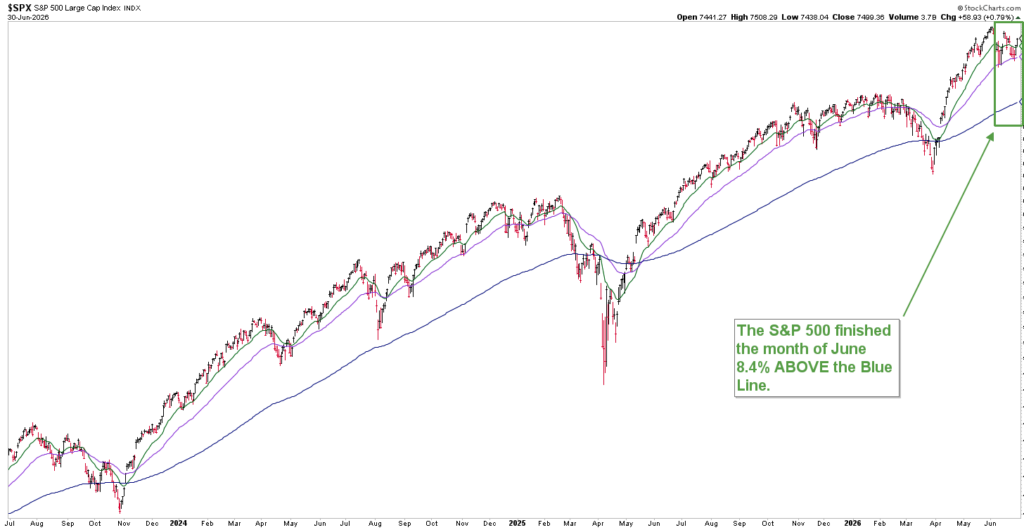 Chart courtesy of StockCharts.com, Data as of 6/30/26
As of the end of June:
- The S&P 500 finished the month 8.4% above the Blue Line
- One month earlier, it stood 11.5% above the Blue Line
Markets will always fluctuate. Headlines will always compete for your attention. Our responsibility is to look beyond the emotion, study the evidence, and advocate for our clients by making disciplined investment decisions based on long-term market trends.
To our clients, thank you for allowing us to be your advocate, and if you’re considering the Blue Line Investing Strategy, we’d welcome the opportunity to show you how our disciplined process seeks to help you Participate. Protect. Prosper.
Jeff Link
Founder
(833) 258-2583
Disclaimers:
The BLUE LINE INVESTING® (BLI) investment process was founded on over 95 years of stock market history. It seeks to identify and align investment decisions with multiyear trends. Various aspects of this process have been illustrated in my book Protecting The Pig: How Stock Market Trends Reveal the Way to Grow and Preserve Your Wealth.
The S&P 500 Index is one of the most commonly followed equity indices, and many consider it one of the best representations of the U.S. stock market, and a bellwether for the U.S. economy. It is comprised of 500 large companies having common stock listed on the NYSE or NASDAQ. The volatility (beta) of the account may be greater or less than the index. It is not possible to invest directly in this index.
Technical analysis is a method of evaluating securities by analyzing statistics generated by market activity, such as past prices and volumes. Technical analysis attempts to predict a future stock price or direction based on market trends. The assumption is that the market follows discernible patterns and if these patterns can be identified then a prediction can be made. The risk is that markets may not always follow patterns. There are certain limitations to technical analysis research, such as the calculation results being impacted by changes in security price during periods of market volatility. Technical analysis is one of many indicators that may be used to analyze market data for investing purposes and should not be considered a guaranteed prediction of market activity. The opinions expressed are those of BLI. The opinions referenced are as of the date of publication and are subject to change without notice. BLI reserves the right to modify its current investment strategies based on changing market dynamics or client needs.
Past performance is not indicative of future results. This material is not financial advice or an offer to sell any product. The information contained herein should not be considered a recommendation to purchase or sell any particular security. Forward-looking statements cannot be guaranteed.
Investment advisory services offered through Guardian Wealth Advisors, LLC D/B/A Blue Line Investing. Guardian Wealth Advisors, LLC (“GWA”) is an investment adviser registered with the U.S. Securities and Exchange Commission. Registration does not imply a certain level of skill or training. More information about GWA’s investment advisory services can be found in its Form CRS or Form ADV Part 2, which is available upon request.
GWA-26-60