
Can an investor remain invested in the stock market while limiting exposure to significant downside risk?
I believe the answer is a confident yes–and the reasoning behind that belief is explored in Chapter 7 of my book.
In this series, we are continuing to examine historical evidence to better understand when stock market trends may be on the verge of changing. My goal is simple: to encourage both current clients and those who have stayed on the sidelines–often out of fear of loss–that there may be a more disciplined why to approach investing.
In Part 2, we turn to another major market decline from the past century. Why revisit these moments? Because during these periods, investors don’t just lose money–they lose time. And for most people, time is the one resource that cannot be replaced.
By the end of this series, we will begin to see the BLUE LINE INVESTING strategy seeks to address this recurring problem. As mentioned in Part 1, if we can identify the one trait shared by every major market decline, we gain the opportunity to do what Michael Jordan advised: “Turn a negative into a positive.”
A Quick Recap
In Part 1, we examined the worst stock market decline in history. If you haven’t read it yet, you can find it here.
The pattern was difficult to ignore:
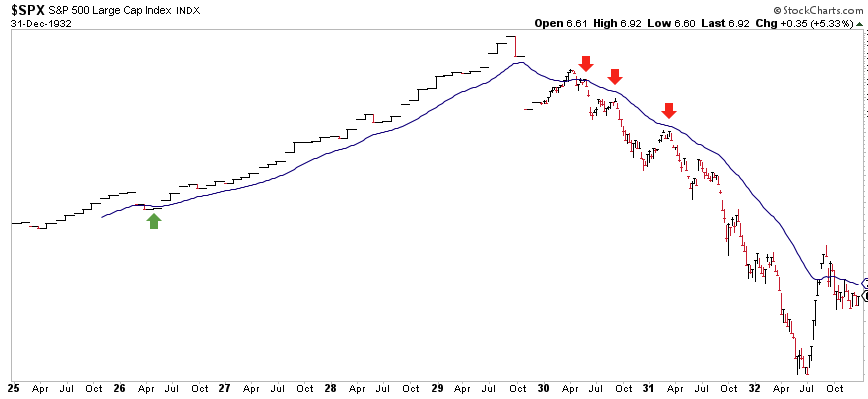
Chart courtesy of StockCharts.com, Data as of 12/31/1932
- In the years leading up to the peak (1925-1928), returns were strongly positive – +25.8%, +11.6%, + 37.5%, and +43.6%–while prices remained above the Blue Line.
- After the peak (1929-1932), returns turned negative– -8.4%, -24.9%, -43.3%, and -8.2%–while prices remained below the Blue Line.
That observation leads to a fair question:
Can investing decisions really be this simple?
If this relationship held true once, what happens when we test it again?
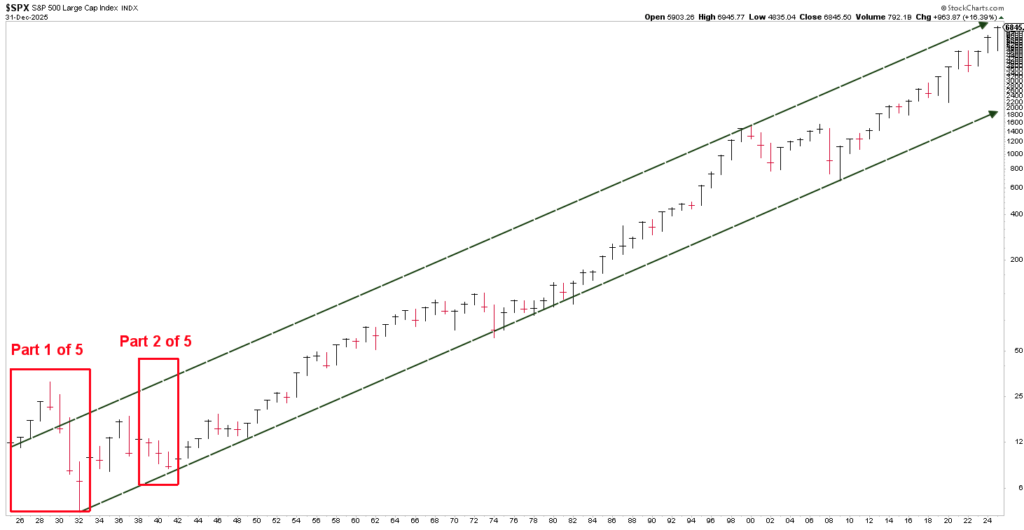
Chart courtesy of StockCharts.com, Data as of 12/31/25
Our Second Historical Example – WWII
Our next example takes us to the early years of World War II.
When the war broke out, capital flowed into the United States as investors sought safety. This created a brief surge in the U.S. stock market beginning in the fall of 1939. But that initial strength did not last.
Once the surge faded, losses followed. Taking note of the point in time identified by the red arrow:
- Market returns from 1939 through 1941 were -.4%, -9.8%, and -11.6%
- During this period, prices remained below the Blue Line.
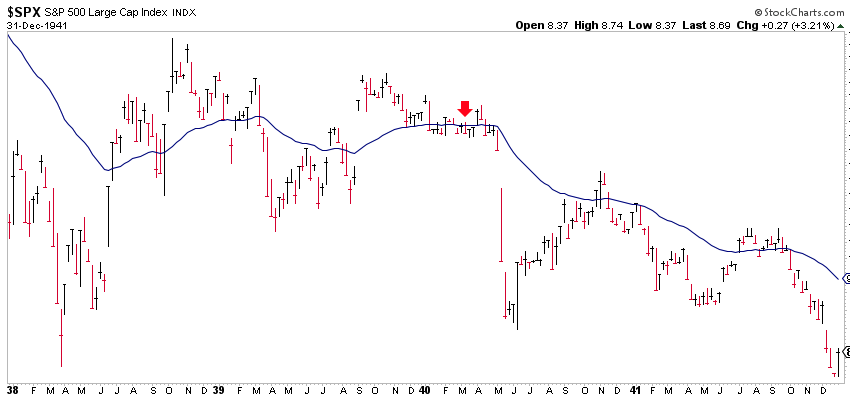
Chart courtesy of StockCharts.com, Data as of 12/31/1941
While these losses may not seem catastrophic compared to other time periods, they reinforce an important point:
The damage is not just financial – it is temporal.
Time spent recovering from avoidable declines can be a lost opportunity cost.
Key Takeaway
In my book, I ask a simple question:
Which comes first–the trend or the return?
From the two examples we’ve reviewed, a pattern begins to emerge: Negative returns tend to occur when price falls below–and remains below–the Blue Line. So how can an investor apply this?
Consider the role of asset allocation. Traditionally, investors spread money across many investments to manage risk. But what if several of those investments are trending downward and trading below their Blue Lines?
At some point, diversification alone stops being protection–and starts becoming exposure. A more practical question might be:
Why hold investments that are already showing signs of weakness?
For an investor seeking growth, choosing to remain in positions where loses are ongoing–or likely to continue–deserves closer scrutiny.
Where We Stand as of Month’s End
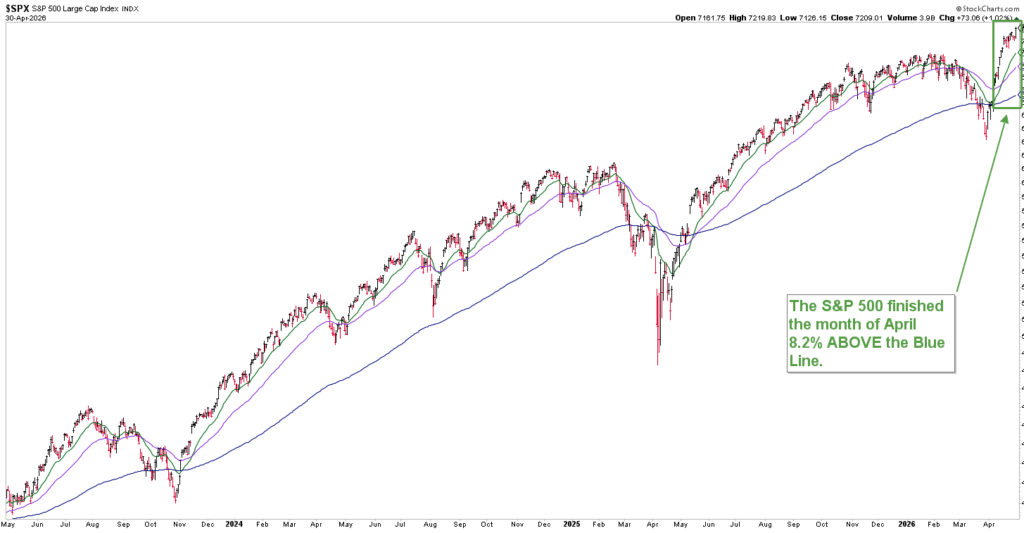 Chart courtesy of StockCharts.com, Data as of 4/30/26
As of the end of April:
- The S&P 500 finished the month 1.2% below the BLUE LINE
- Compared to 1.2% below it just one month prior
These monthly updates have been shared consistently for over a decade for those who find value in them. However, there may come a time–likely when clarity matters most–when these insights will be reserved exclusively for BLUE LINE INVESTING clients. Now is the time to take a closer look at where you stand–and whether your strategy is prepared for what may come next. If that’s a conversation you or someone you know may find helpful, I can be reached at (833) 258-2583.
Jeff Link
Founder
Disclaimers:
The BLUE LINE INVESTING® (BLI) investment process was founded on over 95 years of stock market history. It seeks to identify and align investment decisions with multiyear trends. Various aspects of this process have been illustrated in my book Protecting The Pig: How Stock Market Trends Reveal the Way to Grow and Preserve Your Wealth.
The S&P 500 Index is one of the most commonly followed equity indices, and many consider it one of the best representations of the U.S. stock market, and a bellwether for the U.S. economy. It is comprised of 500 large companies having common stock listed on the NYSE or NASDAQ. The volatility (beta) of the account may be greater or less than the index. It is not possible to invest directly in this index.
Technical analysis is a method of evaluating securities by analyzing statistics generated by market activity, such as past prices and volumes. Technical analysis attempts to predict a future stock price or direction based on market trends. The assumption is that the market follows discernible patterns and if these patterns can be identified then a prediction can be made. The risk is that markets may not always follow patterns. There are certain limitations to technical analysis research, such as the calculation results being impacted by changes in security price during periods of market volatility. Technical analysis is one of many indicators that may be used to analyze market data for investing purposes and should not be considered a guaranteed prediction of market activity. The opinions expressed are those of BLI. The opinions referenced are as of the date of publication and are subject to change without notice. BLI reserves the right to modify its current investment strategies based on changing market dynamics or client needs.
Past performance is not indicative of future results. This material is not financial advice or an offer to sell any product. The information contained herein should not be considered a recommendation to purchase or sell any particular security. Forward-looking statements cannot be guaranteed.
Investment advisory services offered through Guardian Wealth Advisors, LLC D/B/A Blue Line Investing. Guardian Wealth Advisors, LLC (“GWA”) is an investment adviser registered with the U.S. Securities and Exchange Commission. Registration does not imply a certain level of skill or training. More information about GWA’s investment advisory services can be found in its Form CRS or Form ADV Part 2, which is available upon request.
GWA-26-39


