
Several years ago, my wife took our youngest son to the mountains of North Carolina to play in a travel soccer tournament. The tournament consisted of three games played over two days on three different soccer fields. Everything was going fine until her phone GPS stopped working on the way to the second soccer field. They found themselves practically stranded, with no one around to ask for directions, or knowing which way to go. Fortunately, they did eventually find the next soccer field and made it to the game on time. The experience, however, created several long moments of fear and anxiety.
Throughout your investing lifetime there will be moments when the stock markets can cause similar emotions of fear and anxiety, especially when declining. Without a GPS system to tell you where prices are in relation to a bottom, fear and panic can set in, and in some cases, lead you to make emotional investment decisions. Fortunately, I believe the stock market does have a type of GPS system, and it is called technical analysis.
Technical analysis can function like a GPS system in that it can help investors identify where the price of an investment is today in relation to where it may be according to its prevailing trend. This can help identify investments worthy of your consideration to buy, those to sell (or even avoid), and at a specific price to do either.
The BLUE LINE INVESTING® investment process is my version of a stock market GPS navigation system. One of the reasons I provide these updates is because I want to keep you informed of what is happening and what may be likely to happen in the months ahead based on what my navigation system is suggesting. This can help you set realistic expectations for your investments over the short, intermediate, and long terms. While every one of us would like to see the market always go up, that isn’t a reasonable expectation.
So, what is my GPS system suggesting now? The following chart has been updated through the end of September. It appears the S&P may be caught within two different trends: a rising trend and a sideways trend.
STOCK MARKET, THE TREND:
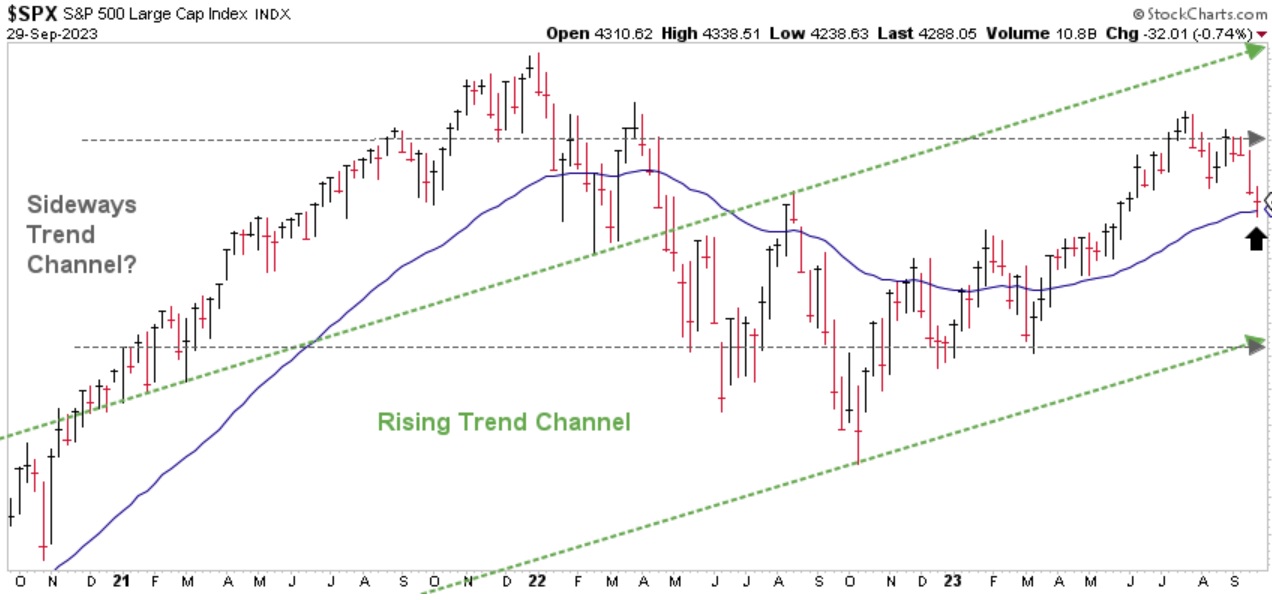
Chart courtesy of StockCharts.com
As I illustrated last month, the green-dashed lines represent the tracks of the stock market roller coaster as it moves steadily toward the summit. Since these tracks are at a rising angle, I expect the S&P could rise to new all-time highs somewhere ahead (i.e. months or years),
However, the recent stock market weakness may be telling us the ride is temporarily “out of service” and in need of repairs. If so, the S&P may be consolidating in a sideways trend within the rising trend. The potential sideways trend is represented by the horizontal, gray-dashed lines on the chart. The fact that the price of the S&P exists within the intersection of these trends helps set our current expectations and future investment strategy.
To keep this relatively simple, if the sideways trend is currently the prevalent trend, then our GPS system is telling us there are delays on the way to our destination (i.e. a future stock market top) and we should be patient while the ride undergoes repairs. The potential good news is that if price holds above both the lower, green-dashed line and the horizontal, gray-dashed lines, the ride should eventually be fixed and resume toward the top. Once again, this could take several months or even a year or two. I referred to this possibility in my April update which can be read here.
STOCK MARKET, WATCHING FOR THE SUMMIT:
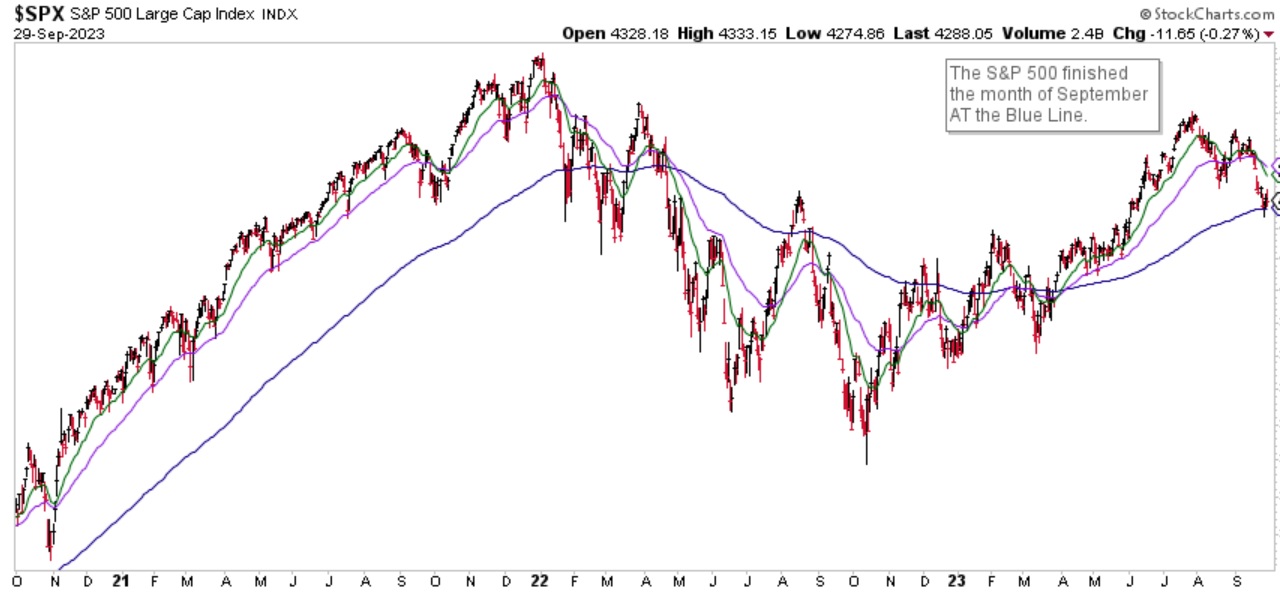
Chart courtesy of StockCharts.com
The S&P finished the month of September at the Blue Line, compared to 6.45% above the Blue Line at the end of August. The S&P is now back to the same prices as in early June. In other words, there haven’t really been any “losses” per se. It’s been more of a retracement (so-far) of recent short-term price gains.
I would characterize this recent pullback as a price correction (Please refer to Chapter 5 of Protecting The Pig for more information). Price corrections can be attractive opportunities to incrementally buy into the market for those investors who are making investments for the first time. Time will tell how this plays out, but rest assured I monitor my GPS system almost daily to make sure we remain on course and expect to arrive at our destination on time.
Thank you for reading this update and please feel free to call with any questions or concerns.
Jeff Link, Founder
Disclaimers:
The BLUE LINE INVESTING® (BLI) investment process was founded on over 95 years of stock market history. It seeks to identify and align investment decisions with multiyear trends. Various aspects of this process have been illustrated in my book Protecting The Pig: How Stock Market Trends Reveal the Way to Grow and Preserve Your Wealth.
The S&P 500 Index is one of the most commonly followed equity indices, and many consider it one of the best representations of the U.S. stock market, and a bellwether for the U.S. economy. It is comprised of 500 large companies having common stock listed on the NYSE or NASDAQ. The volatility (beta) of the account may be greater or less than the index. It is not possible to invest directly in this index.
Technical analysis is a method of evaluating securities by analyzing statistics generated by market activity, such as past prices and volumes. Technical analysis attempts to predict a future stock price or direction based on market trends. The assumption is that the market follows discernible patterns and if these patterns can be identified then a prediction can be made. The risk is that markets may not always follow patterns. There are certain limitations to technical analysis research, such as the calculation results being impacted by changes in security price during periods of market volatility. Technical analysis is one of many indicators that may be used to analyze market data for investing purposes and should not be considered a guaranteed prediction of market activity. The opinions expressed are those of BLI. The opinions referenced are as of the date of publication and are subject to change without notice. BLI reserves the right to modify its current investment strategies based on changing market dynamics or client needs.
Past performance is not indicative of future results. This material is not financial advice or an offer to sell any product. The information contained herein should not be considered a recommendation to purchase or sell any particular security. Forward-looking statements cannot be guaranteed.
Guardian Wealth Advisors, LLC (“GWA”) is an investment adviser registered with the U.S. Securities and Exchange Commission. Registration does not imply a certain level of skill or training. More information about GWA’s investment advisory services can be found in its Form CRS or Form ADV Part 2, which is available upon request.
GWA-23-72

