
Every investor has a personal financial objective, and for many, it requires growing (and occasionally preserving) their wealth. For the past couple months, I have been writing that I believe the US stock market is in the process of climbing a mountain and will eventually reach its peak. History suggests that when it does, there will be one direction for stock prices thereafter: down. Like Tyrone Davis sang, “What goes up, must come down.” But does it have to be this way for every investor?
In last month’s update I said I would share an investing secret using the movie TOP GUN: MAVERICK for illustration. In this movie, the objective of the NAVY pilots is to bomb a uranium enrichment facility located in the valley of a mountain. To access the target, they must first ascend the mountain and avoid surface-to-air missiles at the peak. The following still shot simulates this part of their mission plan.

TOP GUN: MAVERICK (2022) Courtesy of Paramount Pictures
For the purposes of this article, I want you to envision the plane representing your investments (or investment strategy), and the pilot as your hired (chosen) Investment Professional (IP). To avoid having your future hopes and dreams shot down upon reaching the stock market peak, what can your pilot do? Please watch the following movie clip which reveals an investing secret at the end.
TOP GUN: MAVERICK (2022) Courtesy of Paramount Pictures
What did the pilot (IP) do with his plane (investments/investment strategy) at the mountain peak? The answer is he turned his plane upside down. In Chapter 7 of my book, Protecting The Pig: How Stock Market Trends Reveal the Way to Grow and Preserve your Wealth, I attempted to show this concept using investment charts. Little did I know that this movie would be released two years later and would illustrate the concept much easier than I could ever describe with words.
For investors who want the opportunity for their wealth to continue rising even when stock markets experience a multi-year decline requires their pilot (IP) to take one primary action: turn their plane (investments) upside down. In other words, investors should consider selling the investments that will fall with the market and buy investments that could rise instead. As an example, for sophisticated investors, this may include buying put options or “shorting” select stock investments. For less sophisticated investors, this may include buying Inverse Exchange-Traded Funds (ETFs).
I discussed this concept last month with Dale Gillham during an interview on Talking Wealth (www.TalkingWealth.com). Normally, a monthly subscription would be required to get access to the interview, but Talking Wealth has very kindly made it available outside their platform so I can share it with you. To watch the full 20-minute interview, please click here. These historical opportunities come along sparingly during most investors’ lifetimes, so being prepared in advance to attempt to take advantage can result in life-changing experiences (if successful).
While the BLUE LINE INVESTING® investment process is designed to help all investors at all ages, I have found the people who tend to benefit most are 50-65 years old, have financial investments in the $500,000-$5,000,000 range, and who want to continue growing their wealth over the years ahead regardless of their age. If you or someone you know fits some or all these characteristics, please reach out. At the time of this writing I have the capacity to help additional people who fit this profile.
STOCK MARKET, THE TREND:
Last month I said the following based on my observations at that time: Price has broken out above the top, green-dashed line, and the next test will be to see if it can hold that line on a pullback. If it can’t, a price correction of between 7-10% seems possible. Fast forwarding to today, what might the markets be telling us now?
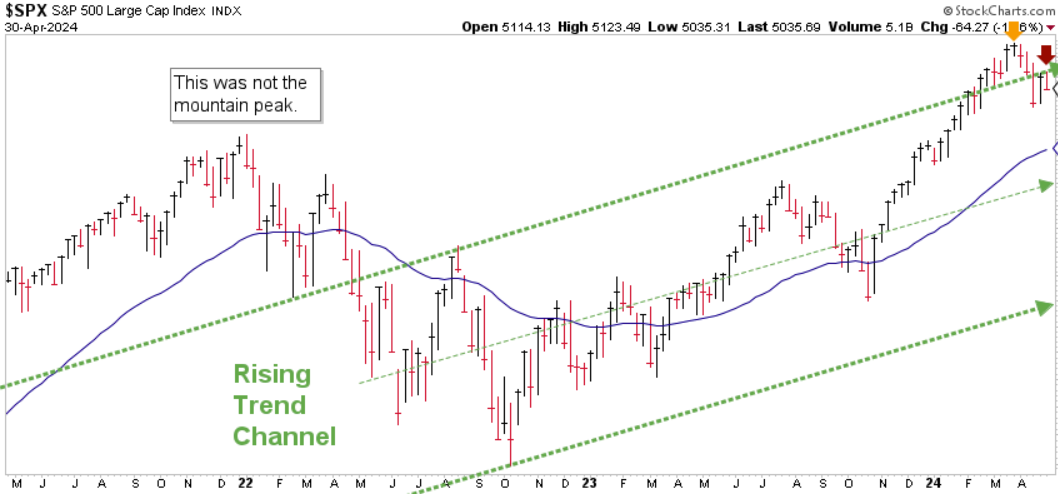
Chart courtesy of StockCharts.com
Over the past month, prices broke down below the top, green-dashed line. I have highlighted this with a red arrow in the upper right-hand corner of the chart above. At this moment, we are now back inside the rising trend channel, which warns us that the future range of possible prices could vary from where we are now to the lowest, rising, green-dashed line. Please keep in mind that this isn’t a prediction, merely a possibility for us to be mindful of.
STOCK MARKET, WATCHING FOR THE SUMMIT:

Chart courtesy of StockCharts.com
The S&P finished the month of April 5.89% above the Blue Line, compared to being 12.60% above the Blue Line at the end of March. So far, this price correction has corrected half of the distance between the recent price high and the Blue Line. Time will tell if there is another 4-6% downside to fulfill my definition of a price correction.
Thank you for your continued trust and support.
Jeff Link
Disclaimers:
The BLUE LINE INVESTING® (BLI) investment process was founded on over 95 years of stock market history. It seeks to identify and align investment decisions with multiyear trends. Various aspects of this process have been illustrated in my book Protecting The Pig: How Stock Market Trends Reveal the Way to Grow and Preserve Your Wealth.
The S&P 500 Index is one of the most commonly followed equity indices, and many consider it one of the best representations of the U.S. stock market, and a bellwether for the U.S. economy. It is comprised of 500 large companies having common stock listed on the NYSE or NASDAQ. The volatility (beta) of the account may be greater or less than the index. It is not possible to invest directly in this index.
Technical analysis is a method of evaluating securities by analyzing statistics generated by market activity, such as past prices and volumes. Technical analysis attempts to predict a future stock price or direction based on market trends. The assumption is that the market follows discernible patterns and if these patterns can be identified then a prediction can be made. The risk is that markets may not always follow patterns. There are certain limitations to technical analysis research, such as the calculation results being impacted by changes in security price during periods of market volatility. Technical analysis is one of many indicators that may be used to analyze market data for investing purposes and should not be considered a guaranteed prediction of market activity. The opinions expressed are those of BLI. The opinions referenced are as of the date of publication and are subject to change without notice. BLI reserves the right to modify its current investment strategies based on changing market dynamics or client needs.
Past performance is not indicative of future results. This material is not financial advice or an offer to sell any product. The information contained herein should not be considered a recommendation to purchase or sell any particular security. Forward-looking statements cannot be guaranteed.
Guardian Wealth Advisors, LLC (“GWA”) is an investment adviser registered with the U.S. Securities and Exchange Commission. Registration does not imply a certain level of skill or training. More information about GWA’s investment advisory services can be found in its Form CRS or Form ADV Part 2, which is available upon request.
GWA-24-35

