
I hope everyone who reads this had a very enjoyable summer. I didn’t write a July update because I was consumed by some new investment revelations that I needed to research further. I’m more excited today about the long-term investment potential of the BLUE LINE INVESTING® Investment Process than when the concept first entered my mind in 2010.
As a quick reminder, calendar year 2022 was a gut punch for many investors, but not for our clients. I believe our process did a great job recognizing the potential warning signs months in advance (which was documented on our website blog) and which led to actively seeking to help protect our clients’ wealth against significant loss. People have been routinely told it is impossible to time the stock market, but last year we showed it to be possible. With this summer’s revelation our strategy playbook has been enhanced further, and I believe our process is prepared to handle whatever the financial markets throw at us in the years ahead.
In this update I will show you why I provide the information I do. Please refer to the following picture as a reference point for my comments that follow.
![]()
It is common for people to compare investing in the stock markets to riding a roller coaster, since over time the prices of the markets rise and fall. But there is one significant difference for people who ride the stock market compared to those who ride the roller coaster–the ones riding the stock market have the choice to get off the ride anytime they wish.
In the picture above I want you to consider what I am about to share beginning from the point of the red arrow, then moving along up the track, and ending at the unfinished track.
If we think about the stock market at the point of the red arrow, most investors are either scared, worried, or indifferent because of the losses that preceded that point. Then as the stock market ride begins to rise and continues to rise (like the roller coaster clicking and clacking its way towards the summit), investors get more and more interested because of past performance. As the ride nears the top, they buy more believing the rising trend will continue forever. But eventually the ride reaches the summit, and once it begins to turn down, investors who longed for above-average investment gains historically receive above-average losses.
Upon reaching the summit, all investors are faced with a decision whether they realize it or not. They can choose to stay on the ride and suffer potentially damaging losses, or they can choose to get off the ride to preserve some or all their wealth. Remember, choosing to remain fully invested is a choice! What many investors don’t realize is these are not the only two choices.
For those people who have read my book, PROTECTING THE PIG, they know there is a third option that not enough people consider. Instead of keeping all investments that could lose as the ride turns down, or even getting off the ride completely by selling all investments, why not consider buying certain investments that offer the potential to go UP as the ride goes DOWN? Like Michael Jordan once said, “Take a negative and turn it into a positive.”
This is what our investment process strives to do. In other words, we strive to help our clients enjoy the ride when the market is in a long-term rising trend, but at those rare times in history when the ride is about to turn down or even fall off the tracks, we strive to help them profit from this potential outcome.
The research and additional discoveries made over this summer helped improve our process further, and I believe it will help improve our odds of achieving such an outcome in the future. I am currently putting the final touches on a presentation that shows how our process uses documented historical patterns of investor behavior to help recognize when stock markets could be topping so we can identify the warning signs to eventually exit the ride.
With all this said, I’ll return to the purpose of these updates. Every month I update the stock market trend, currently identified by green-dashed lines. This trend is symbolic of the roller coaster tracks in the picture. If the trend is rising, I believe there is little reason for investors to worry. Most people aren’t scared while the roller coaster ride is steadily making its way to the summit.
STOCK MARKET, THE RIDE:
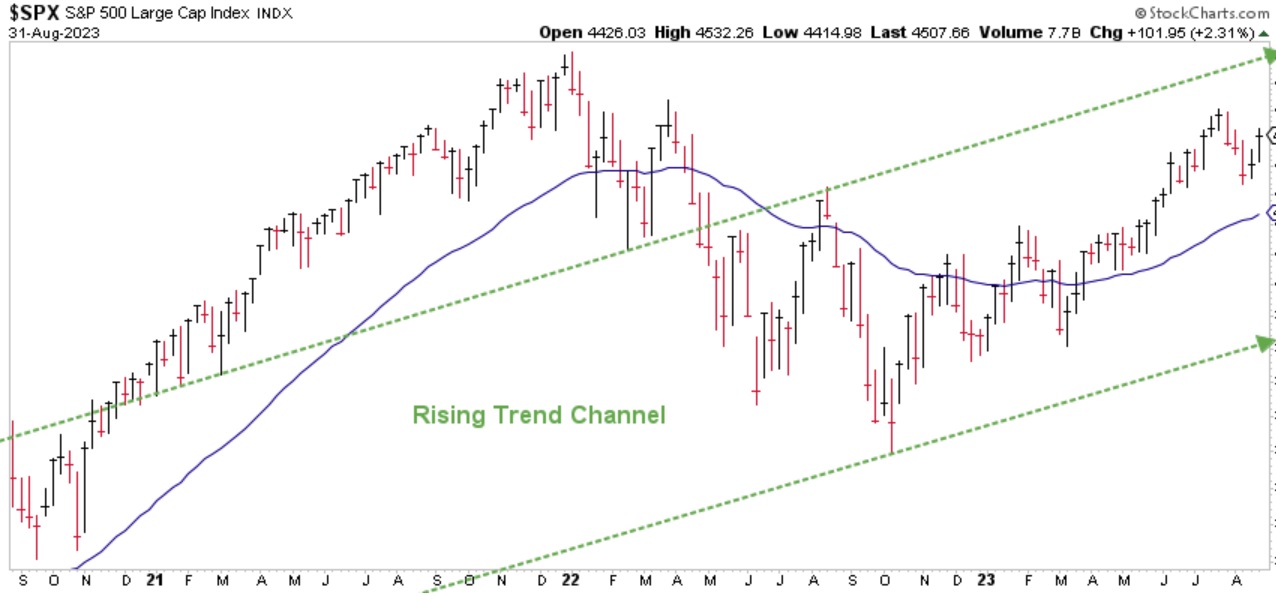
Chart courtesy of StockCharts.com
However, investors who want to exercise their choice to eventually get off the ride must have a way to recognize the inflection point when the summit is potentially reached. This is where the BLUE LINE in the following chart comes into play. The BLUE LINE helps act as one of several indicators to identify the inflection point when the trend may be changing from rising to falling.
STOCK MARKET, THE RIDE:
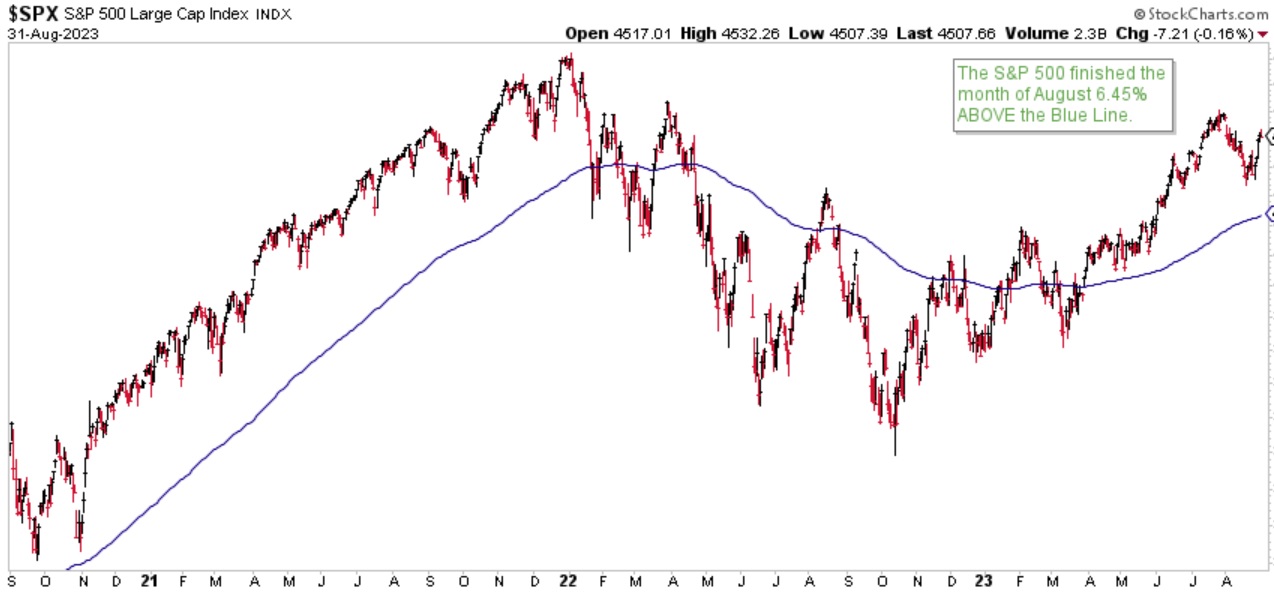
Chart courtesy of StockCharts.com
I hope this explanation helps put our investment process into better perspective and why I update these charts monthly–to keep everyone informed of what I believe is the current trend. So many investors lose money during major downturns because they don’t follow a process to actively look for the warnings that historically precede the losses.
Returning to the picture of the roller coaster, the unfinished track represents the inflection point that will likely come sometime in the future. This is where every investor will get the opportunity to exercise their choice and determine their financial future. While meeting with a long-time client yesterday he made a great observation, saying, “Investors need to realize we are likely in the seventh inning of a nine-inning game.” I agree. While I continue to believe more gains are likely ahead, investors not looking for the warning signs in the future will likely remain on the roller coaster and ride it all the way down.
The S&P finished the month of August 6.45% above the Blue Line, compared to 8.46% above the Blue Line at the end of June. Until the S&P falls below and remains below the BLUE LINE, prolonged, damaging losses are not historically likely.
Thank you for reading this update.
Jeff Link
Disclaimers:
The BLUE LINE INVESTING® (BLI) investment process was founded on over 95 years of stock market history. It seeks to identify and align investment decisions with multiyear trends. Various aspects of this process have been illustrated in my book Protecting The Pig: How Stock Market Trends Reveal the Way to Grow and Preserve Your Wealth.
The S&P 500 Index is one of the most commonly followed equity indices, and many consider it one of the best representations of the U.S. stock market, and a bellwether for the U.S. economy. It is comprised of 500 large companies having common stock listed on the NYSE or NASDAQ. The volatility (beta) of the account may be greater or less than the index. It is not possible to invest directly in this index.
Technical analysis is a method of evaluating securities by analyzing statistics generated by market activity, such as past prices and volumes. Technical analysis attempts to predict a future stock price or direction based on market trends. The assumption is that the market follows discernible patterns and if these patterns can be identified then a prediction can be made. The risk is that markets may not always follow patterns. There are certain limitations to technical analysis research, such as the calculation results being impacted by changes in security price during periods of market volatility. Technical analysis is one of many indicators that may be used to analyze market data for investing purposes and should not be considered a guaranteed prediction of market activity. The opinions expressed are those of BLI. The opinions referenced are as of the date of publication and are subject to change without notice. BLI reserves the right to modify its current investment strategies based on changing market dynamics or client needs.
Past performance is not indicative of future results. This material is not financial advice or an offer to sell any product. The information contained herein should not be considered a recommendation to purchase or sell any particular security. Forward-looking statements cannot be guaranteed.
Guardian Wealth Advisors, LLC (“GWA”) is an investment adviser registered with the U.S. Securities and Exchange Commission. Registration does not imply a certain level of skill or training. More information about GWA’s investment advisory services can be found in its Form CRS or Form ADV Part 2, which is available upon request.
GWA-23-68

