
Let’s begin this month’s update by looking at the past. The S&P 500 Index from 1942 through 1951 consisted of three trends. The first was a rising trend (#1) into 1946. The second was a sideways trend that consolidated prior gains through 1949. The third was a rising trend (#2) that began in 1950 at the completion of the sideways trend.
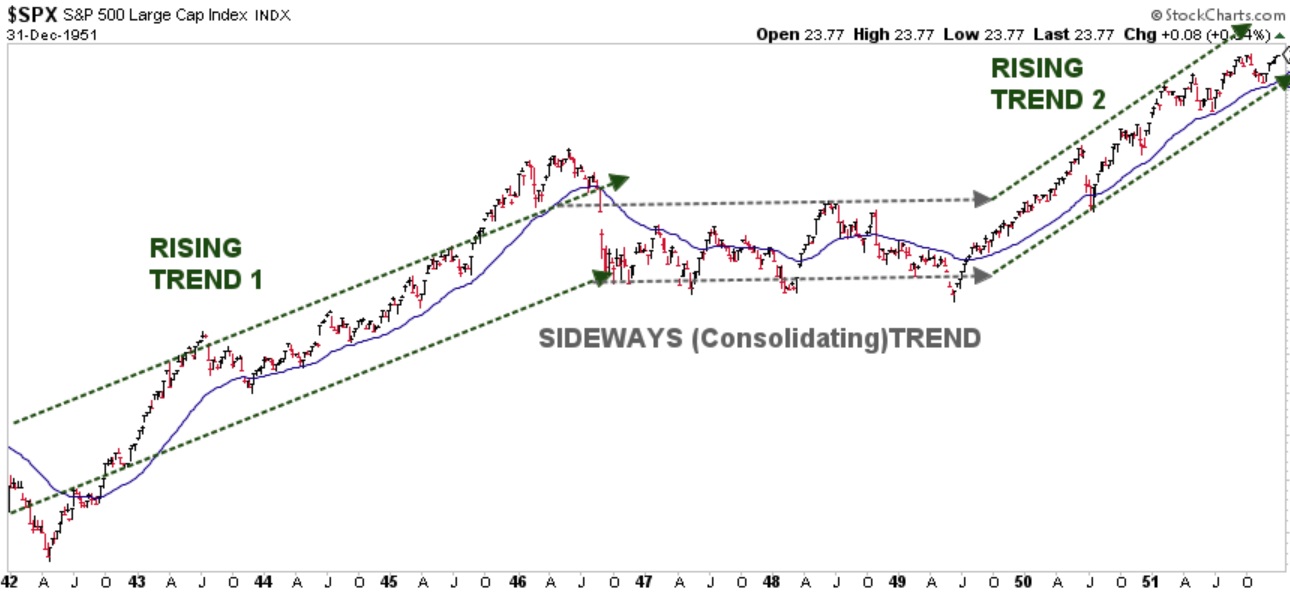
Chart courtesy of StockCharts.com
It can be easy to get wrapped up in the day’s headlines, causing some investors to make emotional investment decisions they later regret. On any given day there are reasons to be invested in the stock market and reasons not to. Our aim is to identify the primary trend so we can look past the emotion grabbing headlines and news stories to make prudent investment decisions.
The reason for showing these historical trends is because the markets today may be in the process of repeating the past. Let’s look beyond today’s headline news and attempt to decipher what the US stock market may be trying to tell us through its recent price movements and trends.
STOCK MARKET, THE TREND:
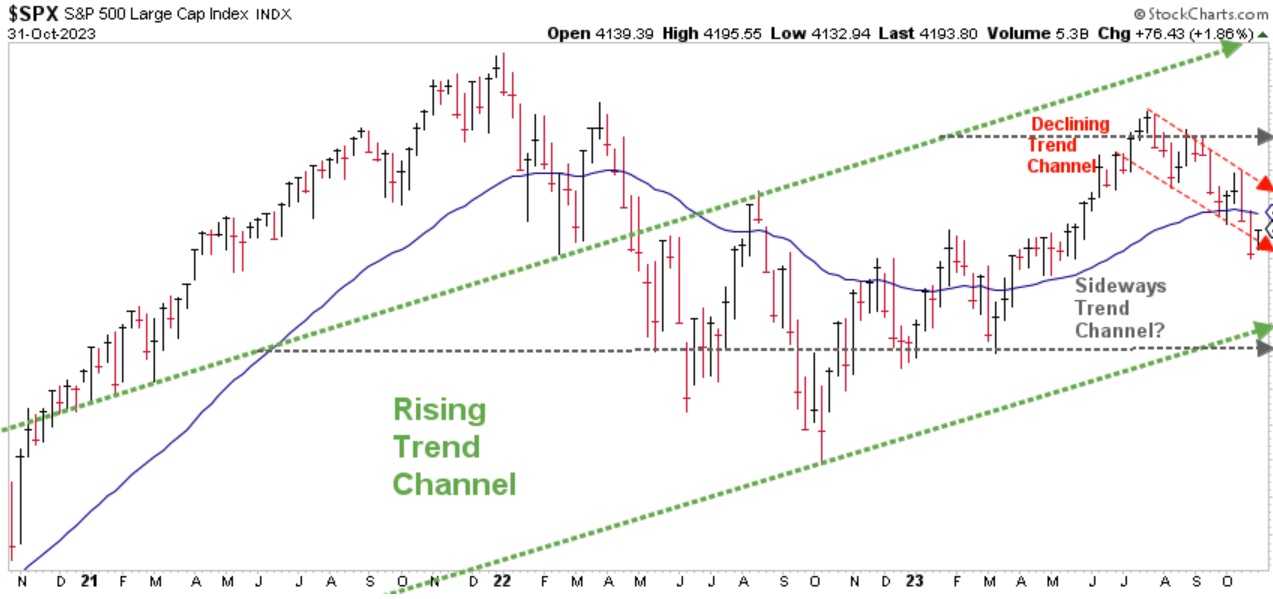
Chart courtesy of StockCharts.com
The chart above illustrates three interwoven trends that I believe are worthy of comment. Two were highlighted in previous updates (the rising and sideways) and a third has been added (a declining trend).
- The green-dashed lines represent what I believe is the current rising trend. The lines represent the potential range, or bounds, that price can remain within over time for this rising trend to continue. Please notice price can decline lower from here and the rising trend would not necessarily be negated.
- The gray-dashed lines represent what may be a sideways, or consolidating trend that seems to be taking place within the rising trend. This is why I showed what happened back in the 1940’s. If this trend becomes the dominant trend, there is potentially good news and bad news. The good news is, we could eventually enjoy higher prices sometime in the future, similar to what happened in the past. The bad news is like the 1940’s, we don’t know if that could be this year, next year, 2025, or even later.
- The red-dashed lines represent the past few months’ price correction. So far, the pullback has not been materially significant.
When we put these trends within trends together, I believe their intersection tells us a story that is more noteworthy than anything we can read from mainstream news headlines. I believe investors should be cautiously optimistic and encouraged that the rising trend currently remains intact. However, the short-term declining trend began near the top of a relatively new sideways trend, suggesting the market may be pausing its advance as it digests all the different events taking place around the world. While we may need to wait longer than we might like, it is still possible that we could eventually see new all-time highs in the US stock markets somewhere ahead.
STOCK MARKET, WATCHING FOR THE SUMMIT:
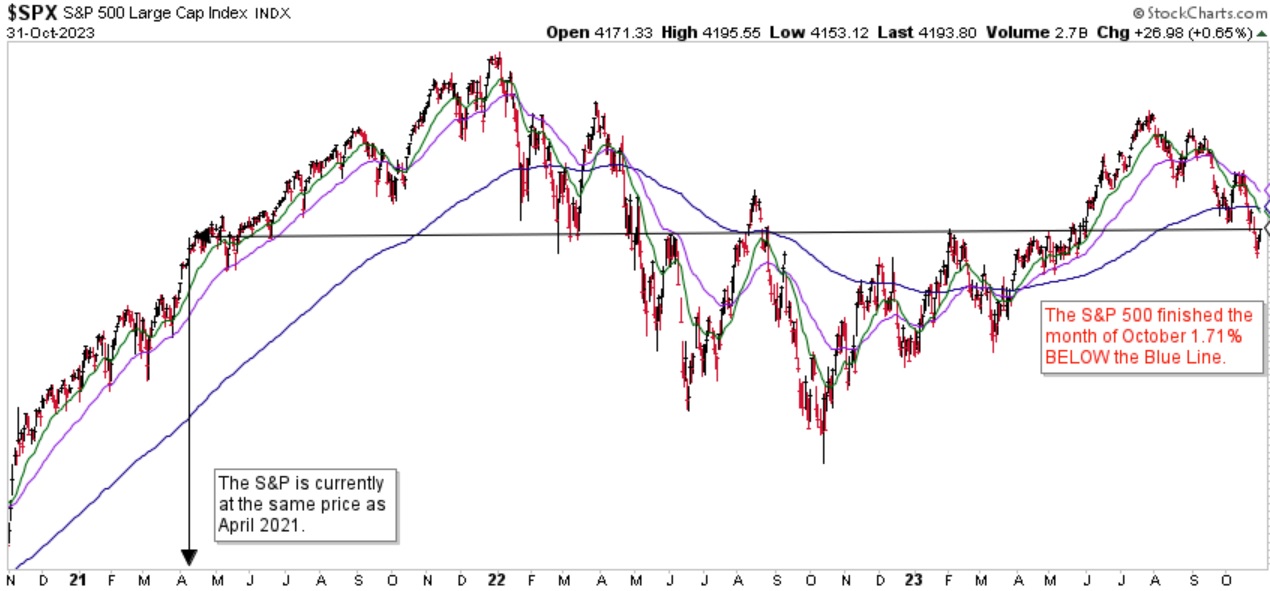
Chart courtesy of StockCharts.com
The S&P finished the month of October 1.71% below the Blue Line, compared to being at the Blue Line at the end of September. As you can see in the chart above, the S&P is now back to the same prices as in early June of 2021, and according to www.slickcharts.com, 202 (40%) of the 503 stocks comprising the S&P have positive returns year-to-date while 301 (60%) have negative returns.
One of the purposes for providing these updates is to attempt to identify when the stock market roller coaster may be nearing its summit. As I have illustrated in recent meetings with several clients, once the markets have reached the summit our goal as profit-seeking investors would be to reconfigure our investments to attempt to profit as the stock market roller coaster plunges. As Michael Jordan said, “Take a negative and turn it into a positive.” Well said Michael, well said.
Jeff Link
Disclaimers:
The BLUE LINE INVESTING® (BLI) investment process was founded on over 95 years of stock market history. It seeks to identify and align investment decisions with multiyear trends. Various aspects of this process have been illustrated in my book Protecting The Pig: How Stock Market Trends Reveal the Way to Grow and Preserve Your Wealth.
The S&P 500 Index is one of the most commonly followed equity indices, and many consider it one of the best representations of the U.S. stock market, and a bellwether for the U.S. economy. It is comprised of 500 large companies having common stock listed on the NYSE or NASDAQ. The volatility (beta) of the account may be greater or less than the index. It is not possible to invest directly in this index.
Technical analysis is a method of evaluating securities by analyzing statistics generated by market activity, such as past prices and volumes. Technical analysis attempts to predict a future stock price or direction based on market trends. The assumption is that the market follows discernible patterns and if these patterns can be identified then a prediction can be made. The risk is that markets may not always follow patterns. There are certain limitations to technical analysis research, such as the calculation results being impacted by changes in security price during periods of market volatility. Technical analysis is one of many indicators that may be used to analyze market data for investing purposes and should not be considered a guaranteed prediction of market activity. The opinions expressed are those of BLI. The opinions referenced are as of the date of publication and are subject to change without notice. BLI reserves the right to modify its current investment strategies based on changing market dynamics or client needs.
Past performance is not indicative of future results. This material is not financial advice or an offer to sell any product. The information contained herein should not be considered a recommendation to purchase or sell any particular security. Forward-looking statements cannot be guaranteed.
Guardian Wealth Advisors, LLC (“GWA”) is an investment adviser registered with the U.S. Securities and Exchange Commission. Registration does not imply a certain level of skill or training. More information about GWA’s investment advisory services can be found in its Form CRS or Form ADV Part 2, which is available upon request.
GWA-23-80

