
Several months ago, Dale Gillham made the comment above while hosting me on one of his Talking Wealth podcast episodes. Ever since, I have wanted to write an article to illustrate its relevance. Today I will do so using the ARK Innovation ETF (Exchange-Traded Fund) that was launched in late October of 2014.
Consider the chart below of the 2015 through 2020 price activity. Price began around $18 per share and six years later closed at $123 per share. Ignoring any dividends, the average annual price gain over these six years was almost 38% per year. And nothing attracts new money and investor interest quite like past performance.
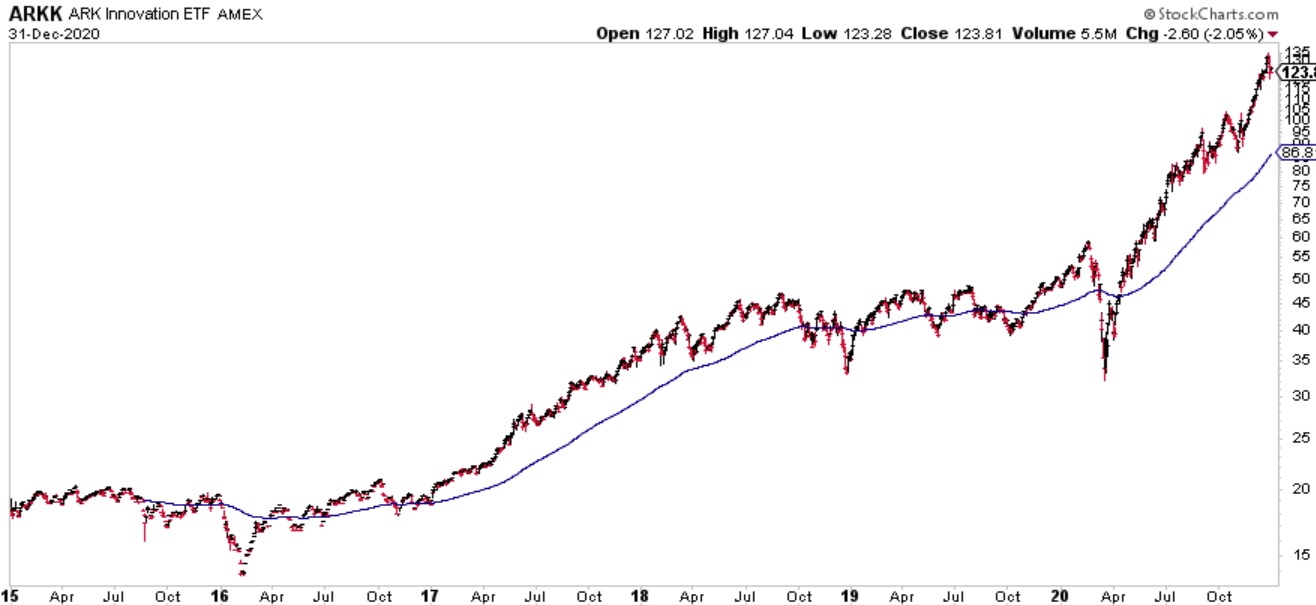
Chart courtesy of StockCharts.com
Performance makes investing challenging for many people. For instance, in the beginning it is likely there were few people who wanted to buy this fund because the past performance was non-existent. But fast forward a few years and lots of people (including investment professionals) wanted to buy it – once again – because of the more recent past performance. So, consider the four primary phases many investments go through during a typical cycle.
PHASE 1: Few people want it
PHASE 2: More people want it
PHASE 3: Lots of people want it
PHASE 4: Many people regret buying it
Consider these four phases in the updated chart below of ARK Innovation ETF through May 16, 2022.
FOUR INVESTOR PHASES
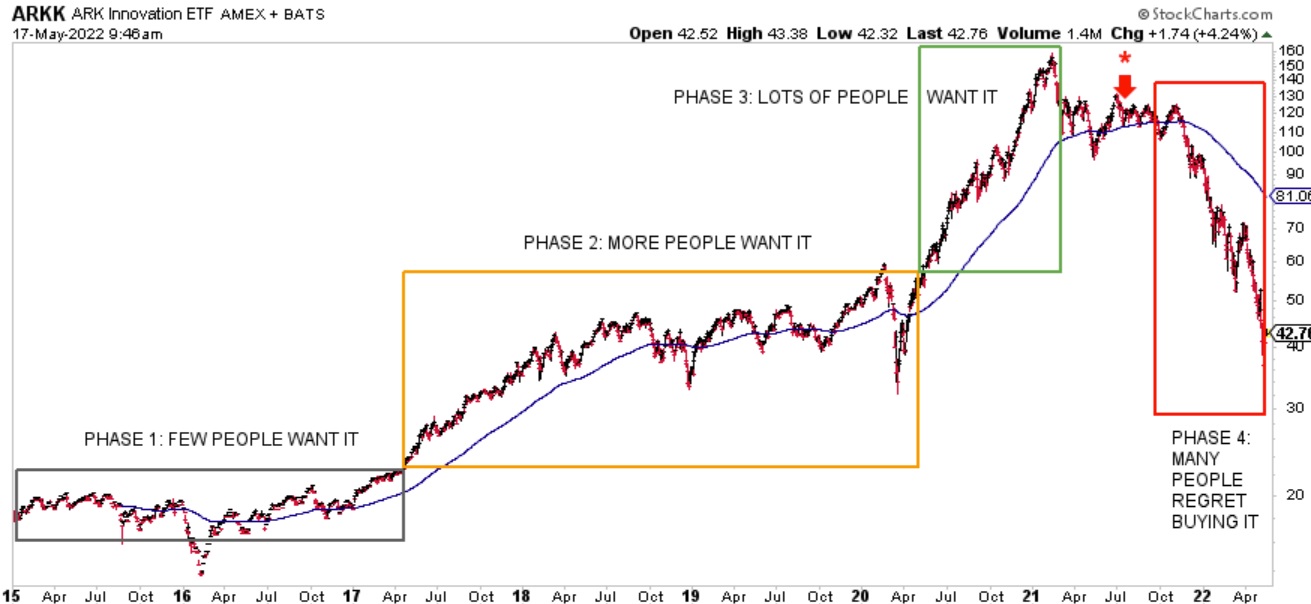
Chart courtesy of StockCharts.com
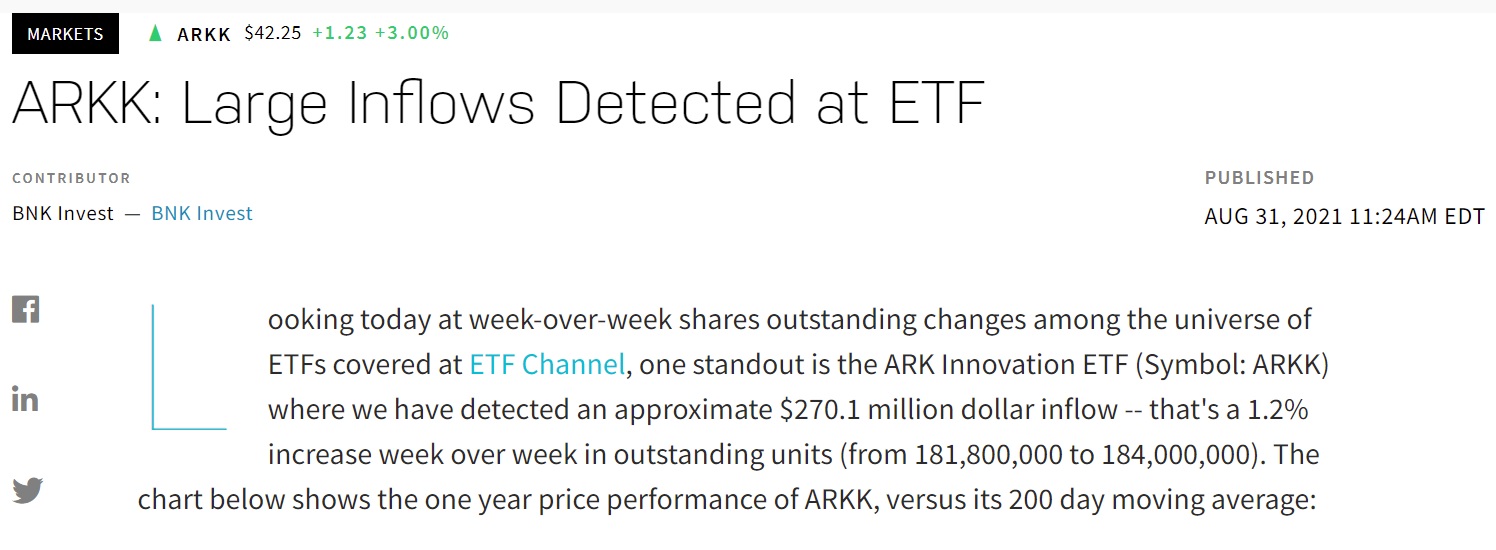
For a little over two years few people wanted it (2015-2016). Then, as price increased, more people wanted it (2017-2019). Then, when price rose high – and became much more expensive – lots of people wanted it (2020). And when a price correction came, some people likely considered it a “buying opportunity.” This is evident from the article that was published in late August of 2021, (https://www.nasdaq.com/articles/arkk%3A-large-inflows-detected-at-etf-2021-08-31) the timing of which has been identified by the red arrow and “*” in the chart above.
Many people not only held their shares, but some people either bought more or were new investors buying for the first time. But as Dale said, “You can’t buy yesterday’s returns.” Since then, the ARK Innovation ETF has lost approximately 65%. I am certain there are many people who are now experiencing Phase 4 and regret having bought it within the past year. Two years of performance have been wiped out and the price is now where it began approximately four years ago.
I remember early in my career an acquaintance who had bought CISCO near the high and as it declined, he said, “That’s okay – I’m a long-term investor. It’s a buying opportunity.” If memory serves me correctly, he eventually sold his investment somewhere in the low 20’s after having bought it in the low 60’s.
When it comes to investing in the stock market, it seems this is the one place where people want to buy less when something goes “on sale” and more as prices become “expensive.” I believe being aware of these four phases and following a sell process can help limit or even avoid those dreaded Phase 4 regrets.
Jeff Link
DISCLAIMERS:
The BLUE LINE INVESTING® (BLI) investment process was founded on over 95 years of stock market history. It seeks to identify and align investment decisions with multiyear trends. Various aspects of this process have been illustrated in my book Protecting The Pig: How Stock Market Trends Reveal the Way to Grow and Preserve Your Wealth.
The S&P 500 Index is one of the most commonly followed equity indices, and many consider it one of the best representations of the U.S. stock market, and a bellwether for the U.S. economy. It is comprised of 500 large companies having common stock listed on the NYSE or NASDAQ. The volatility (beta) of the account may be greater or less than the index. It is not possible to invest directly in this index.
Technical analysis is a method of evaluating securities by analyzing statistics generated by market activity, such as past prices and volumes. Technical analysis attempts to predict a future stock price or direction based on market trends. The assumption is that the market follows discernible patterns and if these patterns can be identified then a prediction can be made. The risk is that markets may not always follow patterns. There are certain limitations to technical analysis research, such as the calculation results being impacted by changes in security price during periods of market volatility. Technical analysis is one of many indicators that may be used to analyze market data for investing purposes and should not be considered a guaranteed prediction of market activity. The opinions expressed are those of BLI. The opinions referenced are as of the date of publication and are subject to change without notice. BLI reserves the right to modify its current investment strategies based on changing market dynamics or client needs.
Past performance is not indicative of future results. This material is not financial advice or an offer to sell any product. The information contained herein should not be considered a recommendation to purchase or sell any particular security. Forward looking statements cannot be guaranteed.
Guardian Wealth Advisors, LLC (“GWA”) is an investment adviser registered with the U.S. Securities and Exchange Commission. Registration does not imply a certain level of skill or training. More information about GWA’s investment advisory services can be found in its Form ADV Part 2 or Form CRS, which is available upon request.
GWA-22-49

