
The Good, the Bad, the Ugly…and the Special
People tend to act in certain predictable ways depending on how they anticipate the future. For instance, if a snowstorm is forecast in the southern US, some people rush out to the grocery store to stock up on groceries (especially bread and milk). If a hurricane is anticipated to come through the Gulf of Mexico and disrupt gasoline supplies, some people rush out to the local gas station and fill up their tanks as a precaution. Over my career I have learned that some stock market investors are no different. Unlike passive investors, active investors position their investments to either capitalize on potential profits or protect against significant loss depending on what they anticipate may happen in the stock market in the future.
On January 7th a SPECIAL REPORT was emailed to all BLUE LINE INVESTING® clients to provide a visual perspective of what I was observing at that time in the markets. I am writing this report to provide an update for those clients who are interested in understanding what I believe are the four most likely scenarios that could play out in the months ahead. I believe the stock market is at a crossroads and it will likely take several weeks or a couple months for the market to provide additional clarity. For those who are inclined, I suggest going back and rereading the original report that was emailed on January 6th to refresh your understanding before continuing with this update.
I call these four potential scenarios the “good,” the “bad,” the “ugly,” and the “special.” I’ll begin with the “good” scenario.
THE “GOOD”
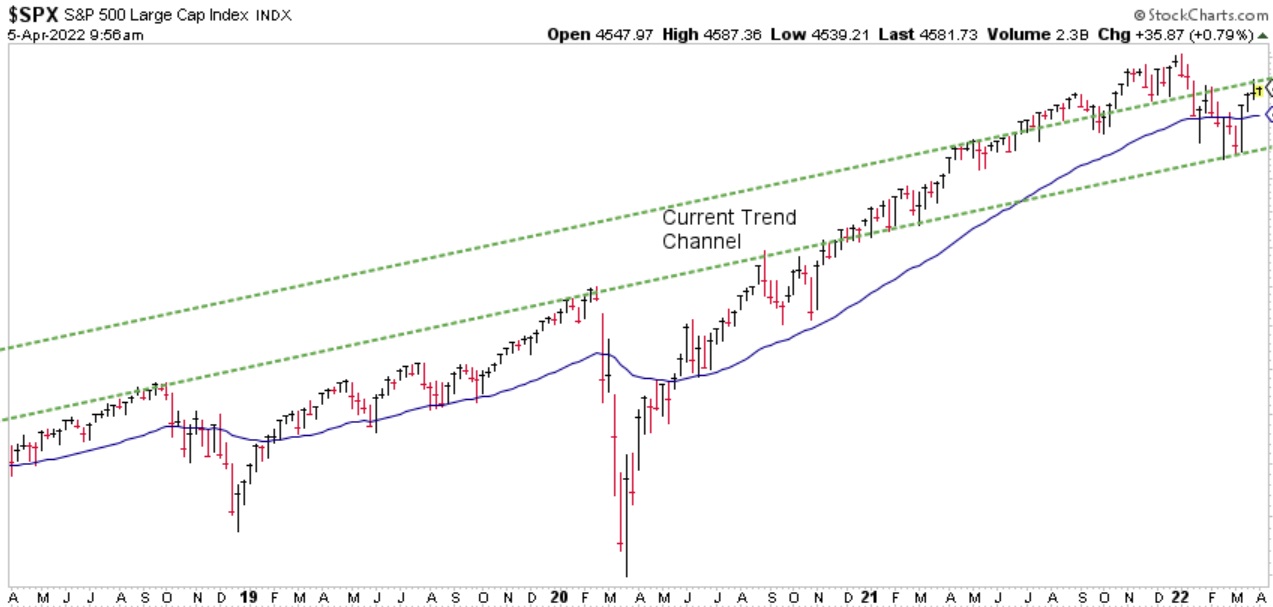
Chart courtesy of StockCharts.com
The chart above illustrates one specific rising trend channel identified by two rising dashed green lines. In mid-2021, price broke out above the top dashed green line and remained above it through the end of the year. But with the first quarter price correction, the market has fallen back inside the channel and recently “bounced” off the lower green dashed line. If price can remain above that lower green dashed line over the months ahead, the market may very well avoid the potential Channel Correction I illustrated in my previous report.
THE “BAD”
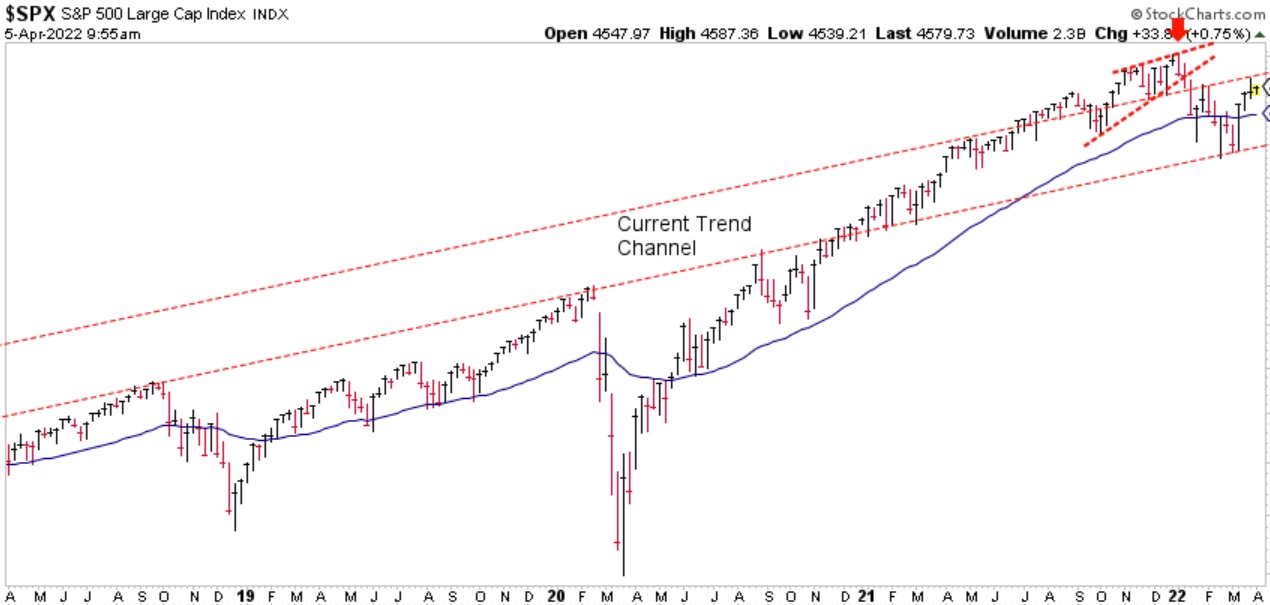
Chart courtesy of StockCharts.com
The chart above illustrates the same rising channel identified in the good scenario, but I have changed the color of the lines to red. The reason I call this the bad scenario is because in the fourth quarter of 2021 the market formed a technical formation called an ascending wedge (identified by the red arrow). This suggested at least a temporary pause in the rising trend.
The potential danger of this is it could be warning of an extended Channel Correction over the months ahead (please refer to page 4 of 7 in my previous special report). Since a sharp channel correction did not take place during the first quarter, what you see above could be alluding to an extended channel correction. If this is the case, I would not expect the broad US stock markets to make any new highs for the next one or two years.
THE “UGLY”
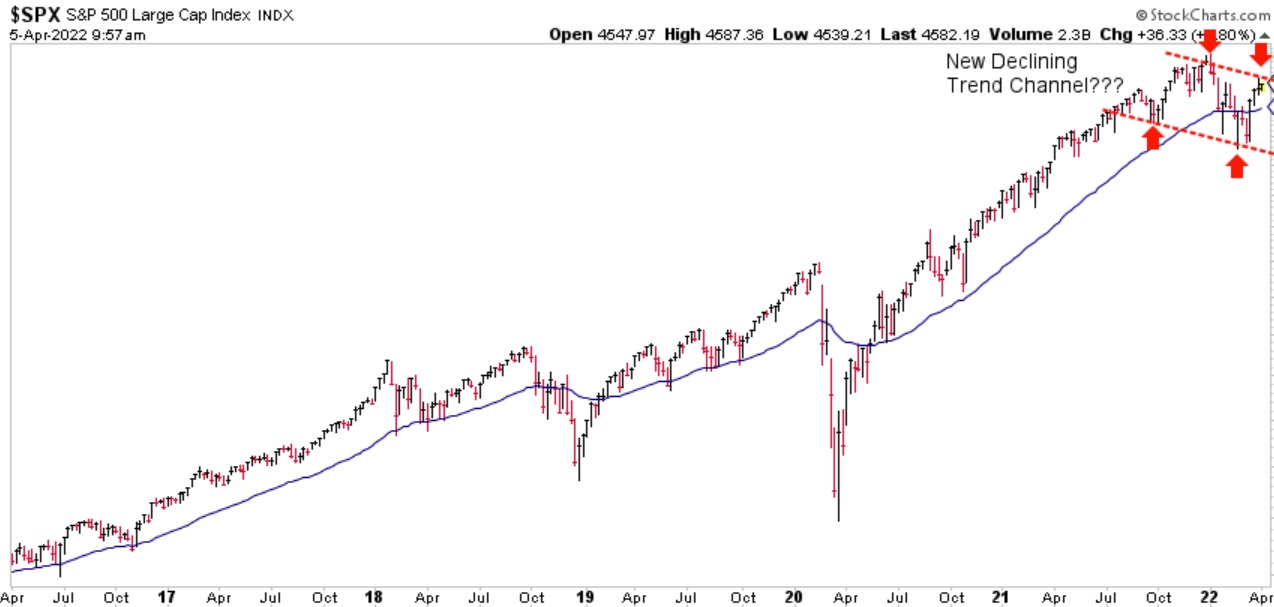
Chart courtesy of StockCharts.com
The chart above illustrates the “ugly” scenario. The two declining dashed red lines represent the outside boundaries of a new potential declining trend channel. So far, the S&P has experienced a series of lower lows followed by lower highs. If this continues, the market may continue declining into 2023. Since the market made a new high the first couple days of this year before experiencing a price correction, history suggests that may be the price high for this calendar year.
THE “SPECIAL”
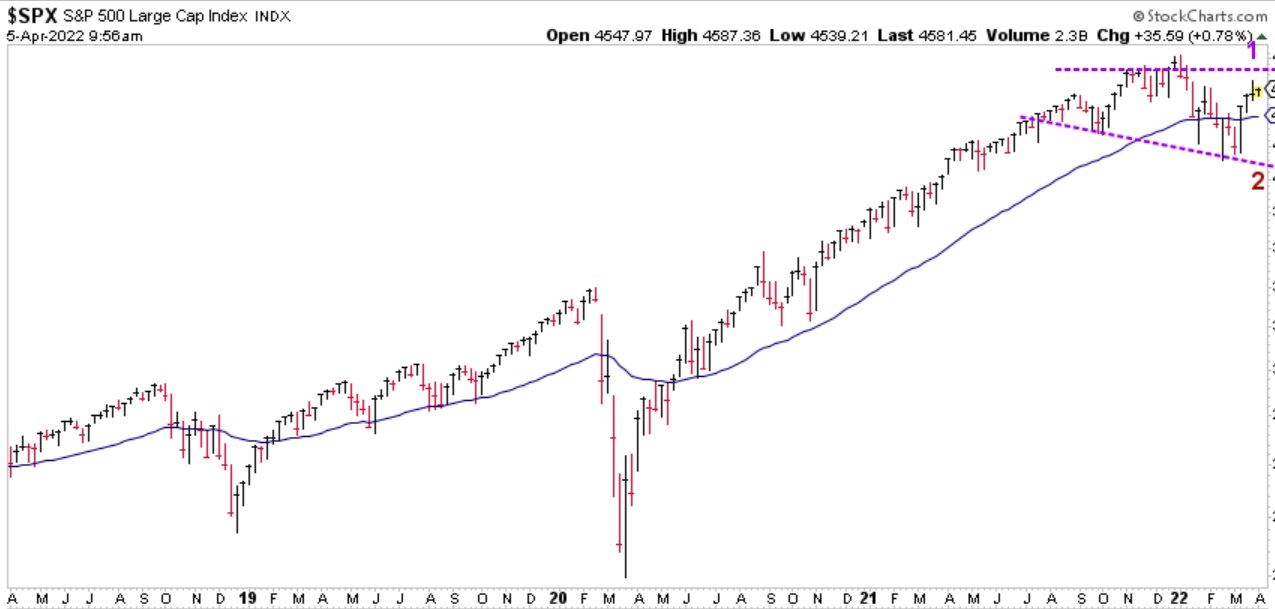
Chart courtesy of StockCharts.com
The chart above illustrates the “special” scenario, which I believe is the most unlikely scenario. However, it would be my favorite if it is. The potential technical pattern above is called a right-angled broadening formation. This could be suggesting much higher prices in the months ahead – but only if the market declines first. Here’s how this could unfold.
The market needs to rise slightly higher to the horizontal dashed purple line identified at #1. It then needs to experience another significant price decline (maybe 15%?) down to the downward sloping dashed purple line at #2. IF this happens, and other indicators lend support to this potential outcome, the market could experience a sharp rally back to and up through the horizontal dashed purple line. In other words, for investors looking to invest new money in the stock market, point #2 might provide a very attractive buying opportunity.
In Chapter 10 of my book, I outlined four different methods investors can use to buy into the stock market or make new investment purchases. These four potential scenarios provide a more detailed understanding of the concepts presented in that chapter.
When it comes to investing, there are times to be greedy and times to be fearful. Right now, I believe the market is at a crossroads and will likely reveal the future direction of the trend in due time. Once it does, I believe investors can have more confidence in their investment decisions and adapt their investments (if necessary) to what they anticipate the future may bring.
Thank you for reading this special report update and please do not hesitate to call me with any questions.
Jeff Link
DISCLAIMERS:
The BLUE LINE INVESTING® (BLI) investment process was founded on over 95 years of stock market history. It seeks to identify and align investment decisions with multiyear trends. Various aspects of this process have been illustrated in my book Protecting The Pig: How Stock Market Trends Reveal the Way to Grow and Preserve Your Wealth.
The S&P 500 Index is one of the most commonly followed equity indices, and many consider it one of the best representations of the U.S. stock market, and a bellwether for the U.S. economy. It is comprised of 500 large companies having common stock listed on the NYSE or NASDAQ. The volatility (beta) of the account may be greater or less than the index. It is not possible to invest directly in this index.
Technical analysis is a method of evaluating securities by analyzing statistics generated by market activity, such as past prices and volumes. Technical analysis attempts to predict a future stock price or direction based on market trends. The assumption is that the market follows discernible patterns and if these patterns can be identified then a prediction can be made. The risk is that markets may not always follow patterns. There are certain limitations to technical analysis research, such as the calculation results being impacted by changes in security price during periods of market volatility. Technical analysis is one of many indicators that may be used to analyze market data for investing purposes and should not be considered a guaranteed prediction of market activity. The opinions expressed are those of BLI. The opinions referenced are as of the date of publication and are subject to change without notice. BLI reserves the right to modify its current investment strategies based on changing market dynamics or client needs.
Past performance is not indicative of future results. This material is not financial advice or an offer to sell any product. The information contained herein should not be considered a recommendation to purchase or sell any particular security. Forward looking statements cannot be guaranteed.
Guardian Wealth Advisors, LLC (“GWA”) is an investment adviser registered with the U.S. Securities and Exchange Commission. Registration does not imply a certain level of skill or training. More information about GWA’s investment advisory services can be found in its Form ADV Part 2, which is available upon request.
GWA-22-30

