
Last month I stated, “You can’t find what you’re not looking for.” What I meant by that is many people I talked with going into the end of 2021 seemed to expect a continued rising stock market for as far as the eye could see. And for many of them, the January price correction likely came as a surprise. So, with the stock market bouncing off recent price lows, should they be looking for higher or lower prices ahead?
The updated chart below through January 31st shows how the S&P broke the Blue Line for the first time in two years. It has since bounced and is back above the Blue Line. So far, the rising trend remains on track. But having said that, I believe it is important to understand that the stock market could drop over 20% further and I would still consider the current trend a rising trend. Let me explain.
PRIMARY TREND: RISING
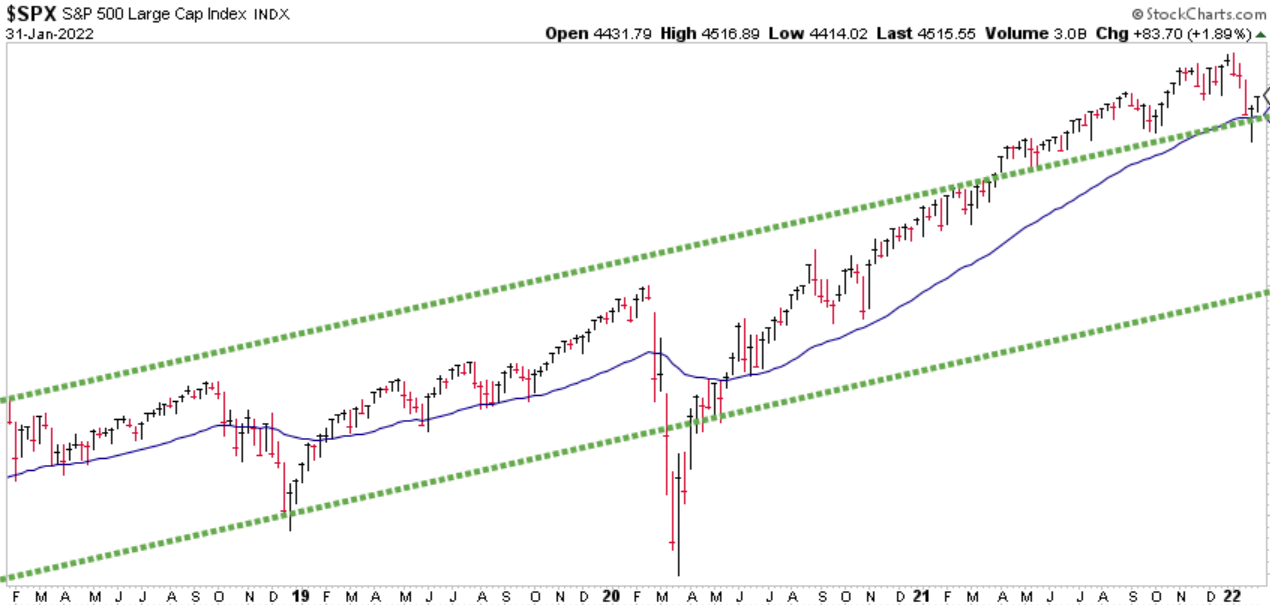
Chart courtesy of StockCharts.com
In the chart above the “space” between the two rising, dashed-green lines represent what I consider the primary trend channel. This is the range I expect prices to normally trade within. However, when price rose above this channel after the first quarter of 2021, history suggests one of two likely outcomes. First, price could continue rising higher for the indefinite future. Or second, price could fall back inside this channel and eventually drop to the lower, green-dashed line. If this second scenario comes to pass over future weeks or months, the market would experience a 20% price drop – while remaining within a rising trend.
In my opinion, the current risk of investment loss is high while the opportunity of sustained investment gain is low. Therefore, I believe every investor should be reevaluating their current investment strategy. Of the three most used strategies by both investors and investment professionals alike, two of the three are likely to follow the stock market down if the second scenario above prevails. I believe tactical strategies that can add protective hedges or limit investment loss in some way could prove favorable and create an opportunity to “Buy Low” in the months ahead should the second scenario play out.
THE “BLUE LINE”: A CLOSER LOOK
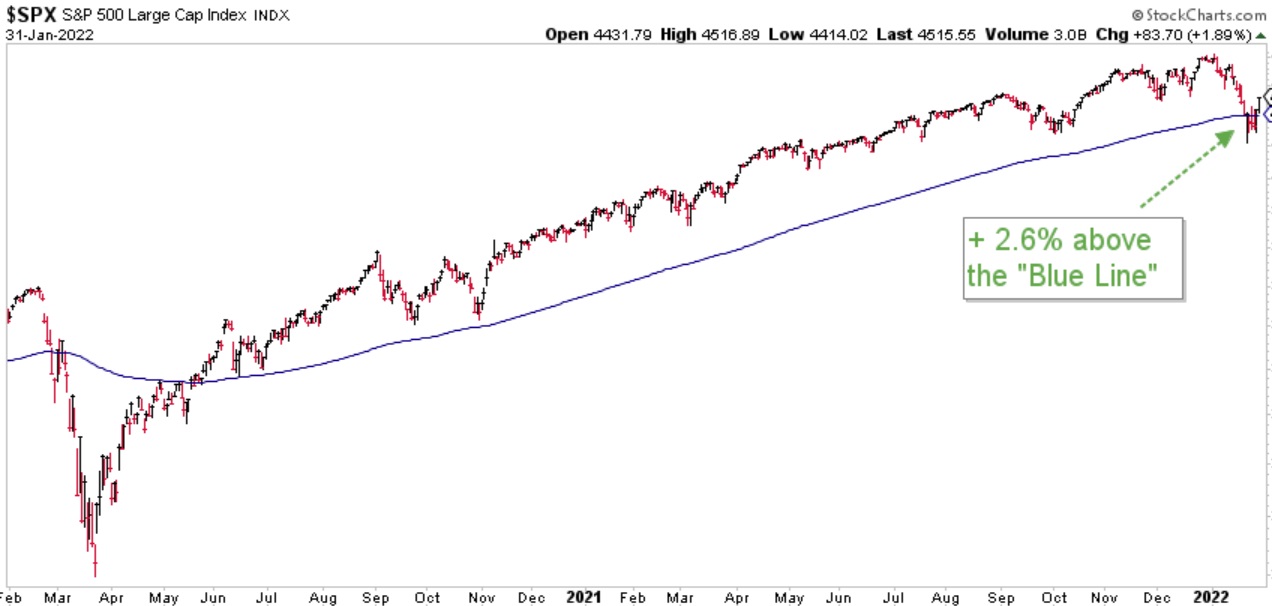
Chart courtesy of StockCharts.com
The S&P finished the month of January 2.6% above the Blue Line, compared to 9.2% above the Blue Line at the end of December.
If you are not currently a BLUE LINE INVESTING® client and do not understand which of the three investment strategies you are using, I am happy to offer a complimentary review of your investment account(s). Please call (833) 258-2583 to take advantage of this offer.
Jeff Link
Disclaimers:
The BLUE LINE INVESTING® (BLI) investment process was founded on over 95 years of stock market history. It seeks to identify and align investment decisions with multiyear trends. Various aspects of this process have been illustrated in my book Protecting The Pig: How Stock Market Trends Reveal the Way to Grow and Preserve Your Wealth.
The S&P 500 Index is one of the most commonly followed equity indices, and many consider it one of the best representations of the U.S. stock market, and a bellwether for the U.S. economy. It is comprised of 500 large companies having common stock listed on the NYSE or NASDAQ. The volatility (beta) of the account may be greater or less than the index. It is not possible to invest directly in this index.
Technical analysis is a method of evaluating securities by analyzing statistics generated by market activity, such as past prices and volumes. Technical analysis attempts to predict a future stock price or direction based on market trends. The assumption is that the market follows discernible patterns and if these patterns can be identified then a prediction can be made. The risk is that markets may not always follow patterns. There are certain limitations to technical analysis research, such as the calculation results being impacted by changes in security price during periods of market volatility. Technical analysis is one of many indicators that may be used to analyze market data for investing purposes and should not be considered a guaranteed prediction of market activity. The opinions expressed are those of BLI. The opinions referenced are as of the date of publication and are subject to change without notice. BLI reserves the right to modify its current investment strategies based on changing market dynamics or client needs.
Past performance is not indicative of future results. This material is not financial advice or an offer to sell any product. The information contained herein should not be considered a recommendation to purchase or sell any particular security. Forward looking statements cannot be guaranteed.
Guardian Wealth Advisors, LLC (“GWA”) is an investment adviser registered with the U.S. Securities and Exchange Commission. Registration does not imply a certain level of skill or training. More information about GWA’s investment advisory services can be found in its Form ADV Part 2, which is available upon request.
GWA-22-12

