
This update highlights what I believe is the current stock market trend (i.e. rising, declining, or sideways) as well as the type of risk that may be looming on the horizon (i.e. price, channel, or trend correction). Please refer to my book Protecting The Pig for additional information.
According to the BLUE LINE INVESTING® process, the current primary trend of the US stock market, as measured by the S&P 500 Index (S&P) is defined as a rising trend.
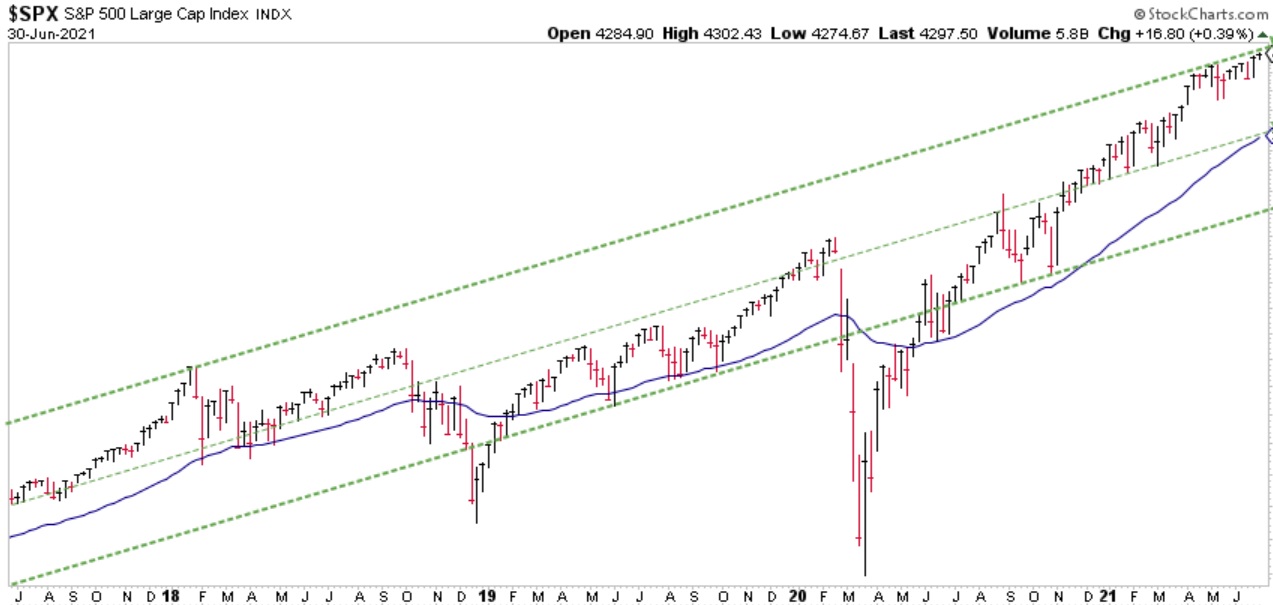
Chart courtesy of StockCharts.com
Aside from two stock market corrections in late 2018 and early 2020, the primary trend has remained within the rising green dashed lines as referenced in the chart above. At this time, I believe these trend ‘channels’ may play a crucial role in the future should the trend change and begin declining. Please refer to chapter six of Protecting The Pig to learn why I believe trend channels are vitally important when attempting to identify potential price tops in the stock market. As David Bach said, “What determines your wealth is not how much you make but how much you keep of what you make.”
THE “BLUE LINE”
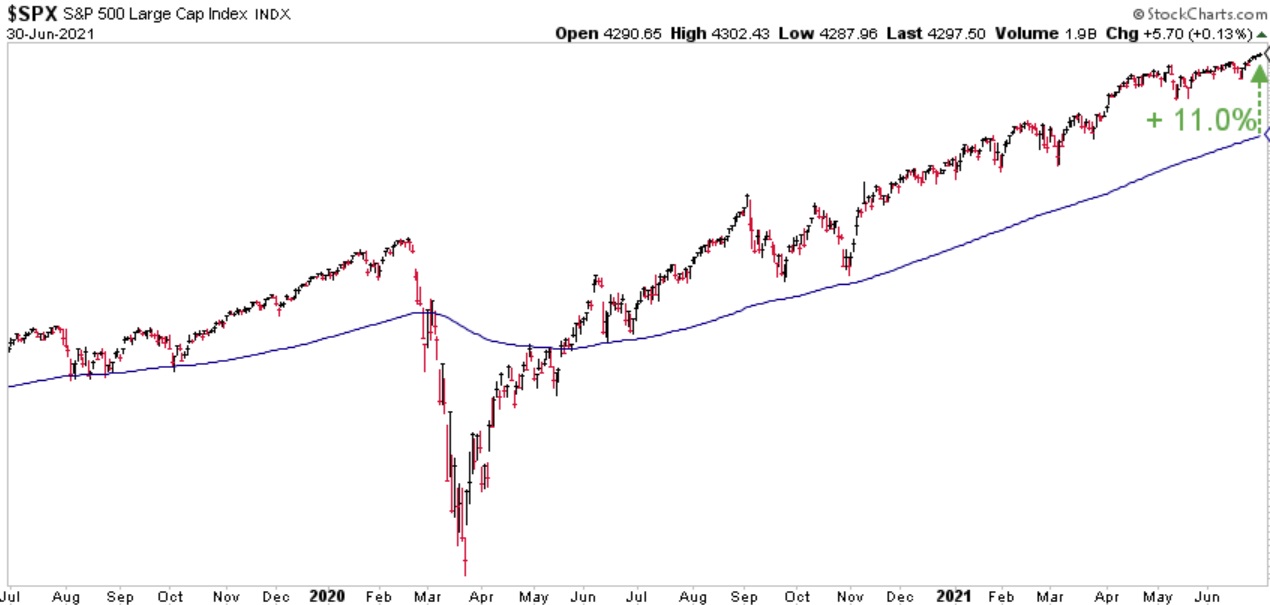
Chart courtesy of StockCharts.com
The S&P finished the month of June 11.0% above the Blue Line, compared to 11.3% above the Blue Line at the end of May (please refer to the green arrow at the far right-hand side of the chart above).
I believe a price correction is the most likely type of risk looming on the horizon. While this is not a prediction; I would like to point out what appears to be historically likely. It has now been over one year since price last touched the Blue Line. While history has shown this can continue for up to three years, it is VERY rare. The only incidence I have been able to document was the three years leading up to the Great Depression (1926 – 1929). One to two years are much more frequent throughout history, so I believe a future price correction of approximately 10-12% should not come as a surprise, if it were to happen.
As a quick reminder, the purpose for providing this monthly update is to illustrate the BLUE LINE INVESTING® process by applying it to the S&P 500 Index. However, this process is applied to all investments held within our strategies.
Thank you for reading and if you know someone who could benefit from a complimentary investment risk analysis, please invite them to sign up for an initial complimentary 30-minute phone or Zoom meeting by going to https://BlueLineInvesting.YouCanBook.Me/.
Jeff Link
Disclaimers:
BLUE LINE INVESTING® (BLI) is an actively managed investment process that pursues our mission by combining a trend following investment philosophy and a “buy low, sell high” investment strategy. Our mission is to grow our client’s financial wealth over a full market cycle in a risk-managed and tax-efficient way.
We monitor the relationship between price and the Blue Line over time to help identify which stock markets worldwide are experiencing rising, sideways, and declining primary trends. We prefer to invest in those markets experiencing rising or sideways primary trends, while avoiding those markets experiencing declining primary trends. The Blue Line helps us identify these trends, and when changes may be taking place.
The S&P 500 Index is one of the most commonly followed equity indices, and many consider it one of the best representations of the U.S. stock market, and a bellwether for the U.S. economy. It is comprised of 500 large companies having common stock listed on the NYSE or NASDAQ. The volatility (beta) of the account may be greater or less than the index. It is not possible to invest directly in this index.
Technical analysis is a method of evaluating securities by analyzing statistics generated by market activity, such as past prices and volumes. Technical analysis attempts to predict a future stock price or direction based on market trends. The assumption is that the market follows discernible patterns and if these patterns can be identified then a prediction can be made. The risk is that markets may not always follow patterns. There are certain limitations to technical analysis research, such as the calculation results being impacted by changes in security price during periods of market volatility. Technical analysis is one of many indicators that may be used to analyze market data for investing purposes and should not be considered a guaranteed prediction of market activity. The opinions expressed are those of BLI. The opinions referenced are as of the date of publication and are subject to change without notice. BLI reserves the right to modify its current investment strategies based on changing market dynamics or client needs.
Past performance is not indicative of future results. This material is not financial advice or an offer to sell any product. The information contained herein should not be considered a recommendation to purchase or sell any particular security. Forward looking statements cannot be guaranteed.
Guardian Wealth Advisors, LLC (“GWA”) is an investment adviser registered with the U.S. Securities and Exchange Commission. Registration does not imply a certain level of skill or training. More information about GWA’s investment advisory services can be found in its Form ADV Part 2, which is available upon request.
GWA-21-37

