
The US stock market, as measured by the S&P 500 Index (S&P), finished the month of October 2.3% above the Blue Line, compared to 7.0% at the end of September. Even with the recent decline, price currently remains above the Blue Line. Please refer to the far right-hand side of the chart below.
BLUE LINE Perspective
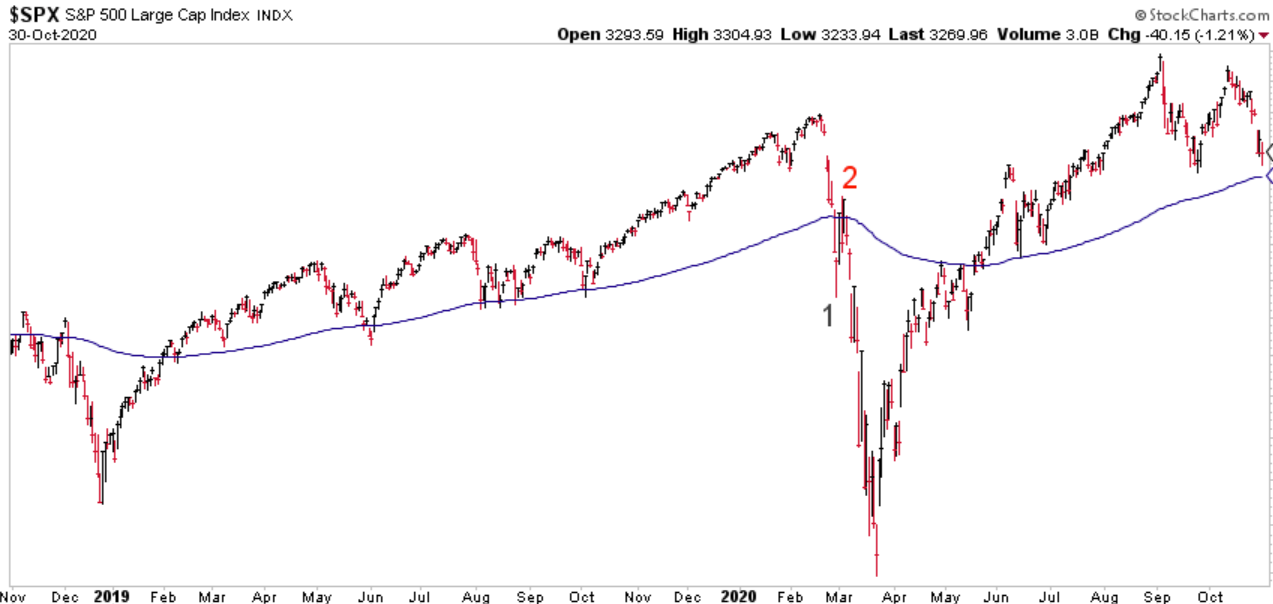
Chart courtesy of StockCharts.com
The purpose of monitoring this relationship between price and the Blue Line is to attempt to identify what type of risk an investment may be experiencing. The three types of risk I have illustrated in Chapter 5 of my book are a price correction, a channel correction, and a trend correction. With price having declined during October but having remained above the Blue Line I would categorize this (so far) as a price correction.
PRIMARY TREND Perspective
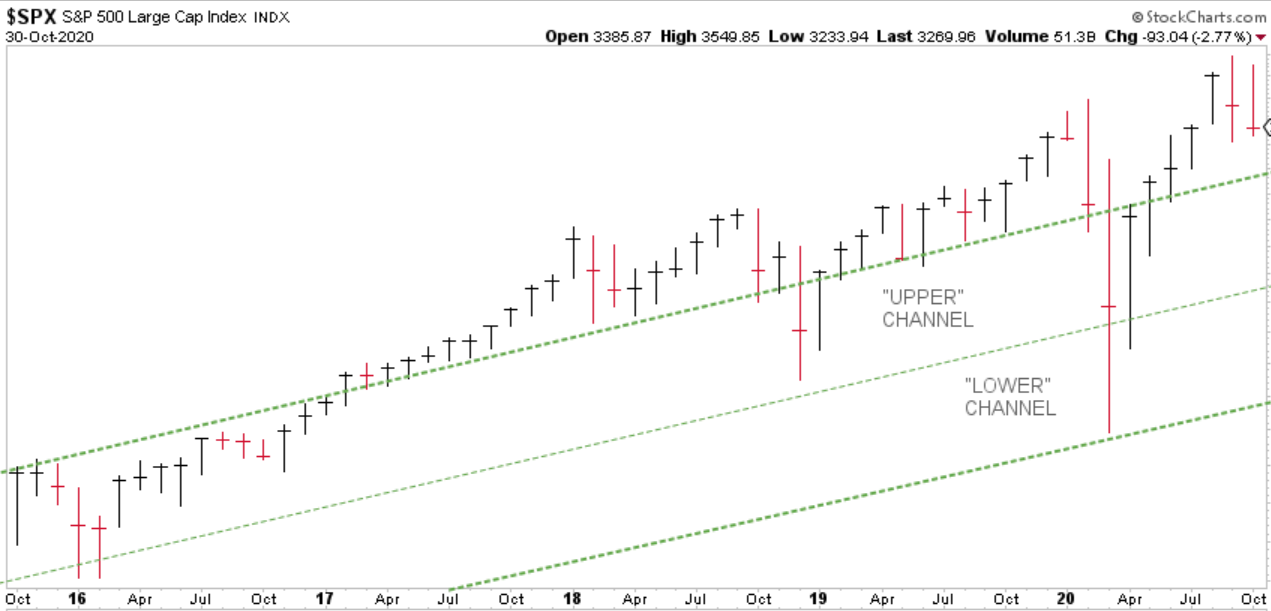
Chart courtesy of StockCharts.com
I have updated this chart from previous posts to replace the weekly price indicator with the monthly. In other words, each red or black line above represents one month of price volatility for the S&P. A red line identifies a month were price closed lower than the close of the previous month, while a black line identifies the opposite. I believe this perspective helps to identify the primary trend more clearly. Based on the evidence illustrated above, I would categorize the current primary trend as a rising trend.
If this trend is identified correctly, it is possible that what we experienced during March of this year was a channel correction. What makes that correction “unique” is so far the S&P has fully rebounded (unlike some other indexes). I have found that historically channel corrections often take one-to-two years to fully recover. This leaves me a little suspect currently.
CHANNEL Perspective
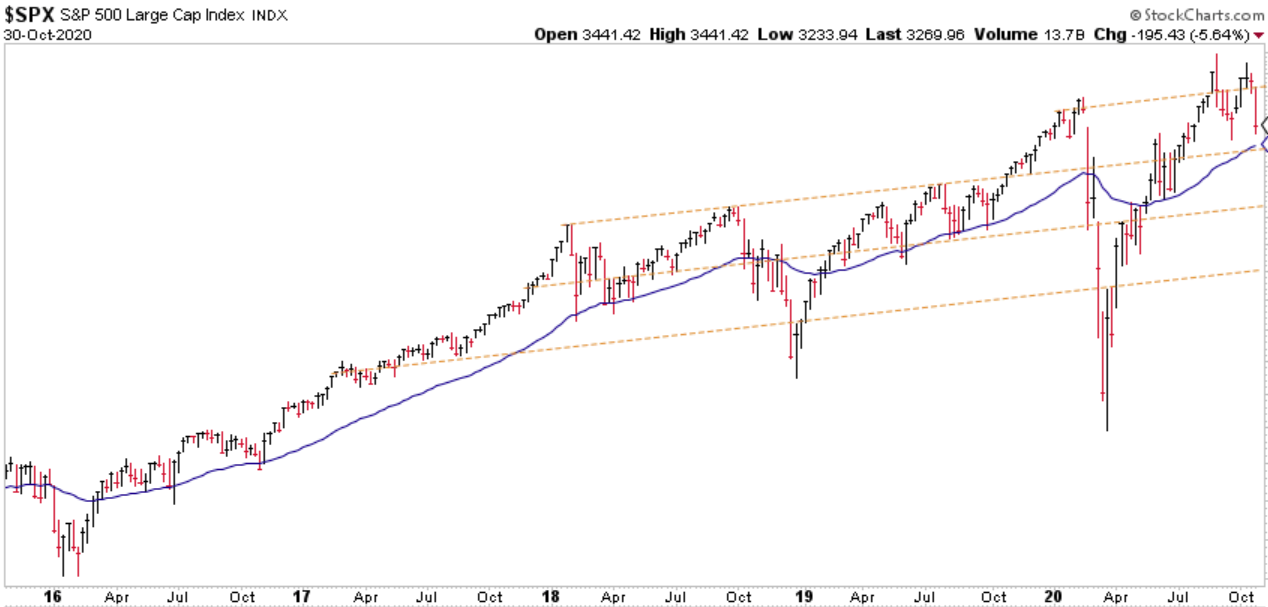
Chart courtesy of StockCharts.com
I have decided to add one more perspective to this monthly update: a channel perspective. Its purpose is to help identify subtle distribution by investors over a prolonged period. This type of behavior tends to precede a changing trend. I have provided a few historical examples of this in Chapter 6 of my book. The orange lines above highlight potential trend channels. While they will be modified from time to time, they can help identify when the dreaded Trend Correction may be forthcoming. You can learn more about trend corrections and how to protect your financial wealth in Chapter 5 of my book.
As a quick reminder, the purpose for providing this monthly update is to illustrate the BLUE LINE INVESTING® process by applying it to the S&P 500 Index. However, this process is applied to all investments held within our strategies. Thank you for reading and please do not hesitate to call (833) 258-2583 with questions or if we may be of service.
Jeff Link
Disclaimers:
BLUE LINE INVESTING® (BLI) is an actively managed investment process that pursues our mission by combining a trend following investment philosophy and a “buy low, sell high” investment strategy. Our mission is to grow our client’s financial wealth over a full market cycle in a risk-managed and tax-efficient way.
We monitor the relationship between price and the Blue Line over time to help identify which stock markets worldwide are experiencing rising, sideways, and declining primary trends. We prefer to invest in those markets experiencing rising or sideways primary trends, while avoiding those markets experiencing declining primary trends. The Blue Line helps us identify these trends, and when changes may be taking place.
The S&P 500 Index is one of the most commonly followed equity indices, and many consider it one of the best representations of the U.S. stock market, and a bellwether for the U.S. economy. It is comprised of 500 large companies having common stock listed on the NYSE or NASDAQ. The volatility (beta) of the account may be greater or less than the index. It is not possible to invest directly in this index.
Technical analysis is a method of evaluating securities by analyzing statistics generated by market activity, such as past prices and volumes. Technical analysis attempts to predict a future stock price or direction based on market trends. The assumption is that the market follows discernible patterns and if these patterns can be identified then a prediction can be made. The risk is that markets may not always follow patterns. There are certain limitations to technical analysis research, such as the calculation results being impacted by changes in security price during periods of market volatility. Technical analysis is one of many indicators that may be used to analyze market data for investing purposes and should not be considered a guaranteed prediction of market activity. The opinions expressed are those of BLI. The opinions referenced are as of the date of publication and are subject to change without notice. BLI reserves the right to modify its current investment strategies based on changing market dynamics or client needs.
Past performance is not indicative of future results. This material is not financial advice or an offer to sell any product. The information contained herein should not be considered a recommendation to purchase or sell any particular security. Forward looking statements cannot be guaranteed.
Guardian Wealth Advisors, LLC (“GWA”) is an investment adviser registered with the U.S. Securities and Exchange Commission. Registration does not imply a certain level of skill or training. More information about GWA’s investment advisory services can be found in its Form ADV Part 2, which is available upon request.
GWA-20-25

