
Beginning in February price volatility returned to the US stock markets with a vengeance. Down 125 points! Up 108! Down 104! Up 87! Daily price changes like these in the S&P 500 Index may cause worry and anxiety for an investor. But should they? Are these individual price movements random? Or when viewed together do they reveal a pattern as the market attempts to tell investors a story?
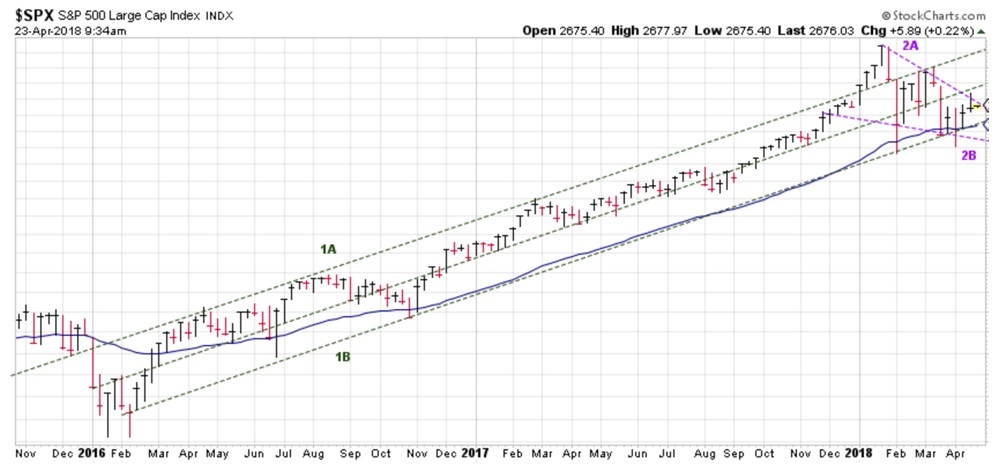
Look at the weekly chart above courtesy of StockCharts.com. I believe there are four specific items worth paying attention to. They are:
- The rising primary trend channel (identified by the green dashed lines labelled 1A and 1B)
- The potential descending wedge (identified by the purple dashed lines labelled 2A and 2B)
- Price (identified by the vertical red and black lines)
- The “Blue Line.”
Using technical analysis, the current story the market may be telling investors is that prices could continue to rise in the not-to-distant future. First, all the daily price movements since February in the S&P 500 Index (and many other indices) have remained predominately above their “Blue Lines.” The Blue Line is our reference point and at present, we remain optimistic.
Second, the primary trend over the past two years has been positive with prices trading within a rising trend channel. This channel has been identified by the dashed green lines labeled “1A” and “1B.” If price continues to remain within this channel, technical analysis suggests higher stock market prices to come.
The third and final piece of the story, at least in the short-term, includes a potential technical formation called a descending wedge. This formation can be identified by the downward-sloping dashed purple lines labeled “2A” and “2B.” This formation, if correct, has been created by all those individual up and down days mentioned in the beginning of this article. If this formation comes to fruition the market may be suggesting prices should break out to the upside above line 2A – eventually.
I believe the combination of all these pieces of information suggest the market may rise higher over the weeks to come. However, it doesn’t mean it can not drop lower first. Even though the story of the market can and will change over time, I believe these individual price movements, in concert with each other, can help investors set their expectations for what may happen next – even in the face of news headlines that may create noise, confusion, and anxiety.
After reading this article and witnessing the symmetry within the market from the chart provided I hope you will begin to see what I began seeing many years ago – individual price movements in the stock market may not be random at all. While it may take some time for the story to develop, I believe stock market price movements tend to be precise, and once investors learn how to recognize these patterns they can hopefully become more successful investors.
Jeff Link
Disclaimers:
¹ Blue Line Investing (BLI) is an alternative to traditional wealth management. BLI uses a disciplined, rules-based investment process to seek investment opportunities, regardless of whether financial markets are rising or falling. Based on technical analysis research, the process applies trend-following using specific Exponential Moving Averages (EMAs) of the market along with other technical indicators. A moving average is a widely used indicator in technical analysis that helps smooth out past price action by filtering out the “noise” from random price fluctuations. EMA’s can be calculated for any time period. Some examples include the 5 day EMA; 50 day EMA; and 150 day EMA. We have attempted to simplify this by calling the various EMAs we use in our process the “Blue”, “Purple” and “Green” lines.
² The S&P 500 Index is one of the most commonly followed equity indices, and many consider it one of the best representations of the U.S. stock market, and a bellwether for the U.S. economy. It is comprised of 500 large companies having common stock listed on the NYSE or NASDAQ. The volatility (beta) of the account may be greater or less than the index. It is not possible to invest directly in this index.
Technical analysis is a method of evaluating securities by analyzing statistics generated by market activity, such as past prices and volumes. Technical analysis attempts to predict a future stock price or direction based on market trends. The assumption is that the market follows discernible patterns and if these patterns can be identified then a prediction can be made. The risk is that markets may not always follow patterns. There are certain limitations to technical analysis research, such as the calculation results being impacted by changes in security price during periods of market volatility. Technical analysis is one of many indicators that may be used to analyze market data for investing purposes and should not be considered a guaranteed prediction of market activity. The opinions expressed are those of Blue Line Investing. The opinions referenced are as of the date of publication and are subject to change without notice. Blue Line Investing reserves the right to modify its current investment strategies based on changing market dynamics or client needs.
Past performance is not indicative of future results. This material is not financial advice or an offer to sell any product. The information contained herein should not be considered a recommendation to purchase or sell any particular security. This information is intended for educational purposes only and should not be considered financial advice. It should not be assumed that the investment recommendations or decisions we make in the future will be profitable or will equal the investment performance of the securities discussed herein. Forward looking statements cannot be guaranteed.
Advisory services offered through Gordon Asset Management, LLC (GAM). GAM is an SEC-registered investment adviser. Registration does not imply a certain level or skill or training. More information about the advisor, its investment strategies and objectives, is included in the firm’s Form ADV Part 2, which can be obtained, at no charge, by calling (866) 216-1920. The principle office of Gordon Asset Management, LLC is located at 1007 Slater Road, Suite 200, Durham, North Carolina, 27703.

