
Last month the US stock market enjoyed a rather impressive price rally, rocketing approximately 9% for the month. Just prior to this, the news headlines were questioning how sound the markets were, even going so far as to quote several people who claimed it was going to crash. Now they are posting headlines that suggest the opposite.
The news media and their headlines can create a lot of confusion for investors, and that’s one of the primary reasons why I strive to ignore them when considering any investment decision. Let’s look at our updated trend chart to view the “big picture” and how we should interpret last month’s price rally from the one perspective that matters–the trend.
STOCK MARKET, THE TREND:
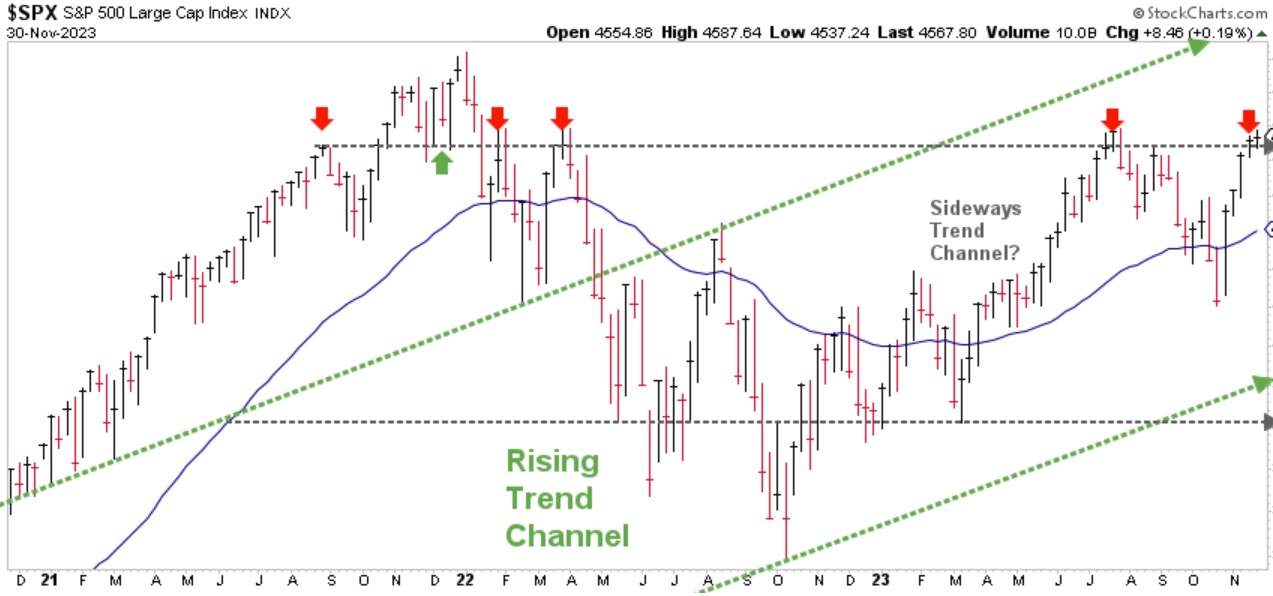
Chart courtesy of StockCharts.com
When looking at this chart, please begin at the red arrow furthest to the right. This is where the price of the S&P finished the month of November, and you will notice it also happens to coincide with the top, gray-dashed line. If you move backwards in time to the left, you will also notice this has tended to be a topping area for the S&P over the past couple years.
Based on the significance of this price resistance line, I believe caution should be exercised at this time. It seems unlikely that after such a strong price rally the market will continue to rise at this time. My personal expectation is for the market to “hang out” around these prices, or maybe even retreat in the near term. Depending on what I observe over the coming days and weeks I may even add some Inverse ETF’s as a short-term, temporary protective hedge.
STOCK MARKET, WATCHING FOR THE SUMMIT:
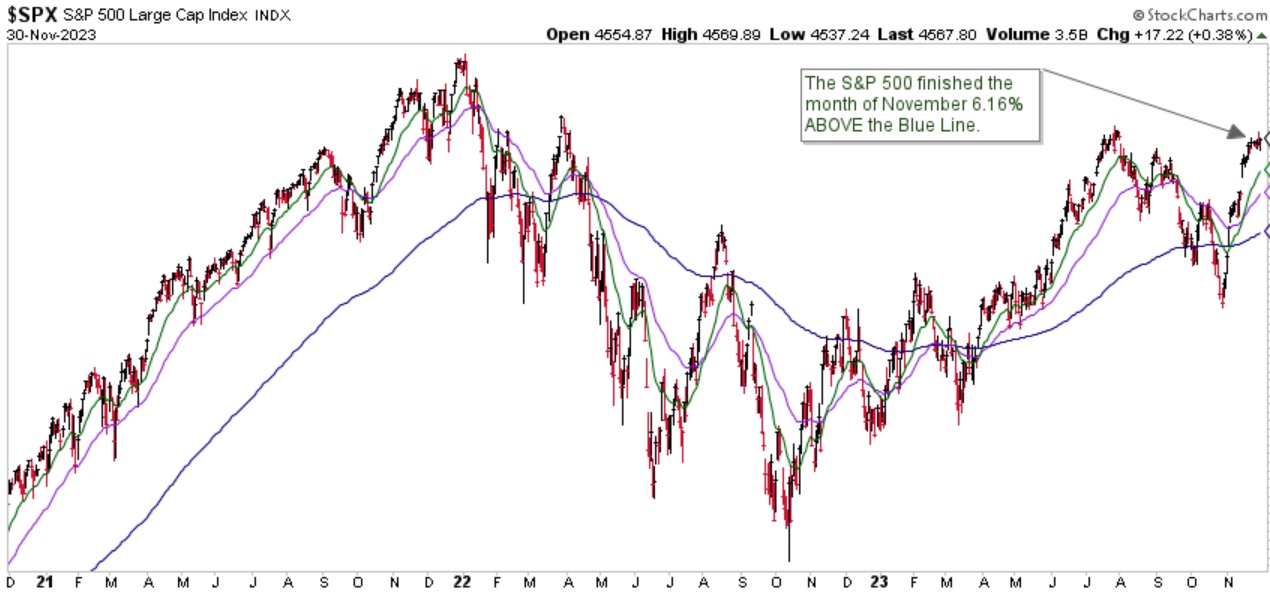
Chart courtesy of StockCharts.com
The S&P finished the month of November 6.16% above the Blue Line, compared to being 1.71% below the Blue Line at the end of October.
Thank you to all our clients for your continued trust, confidence, and support and I hope you are able to enjoy some downtime with friends and family over the coming weeks.
Jeff Link
Disclaimers:
The BLUE LINE INVESTING® (BLI) investment process was founded on over 95 years of stock market history. It seeks to identify and align investment decisions with multiyear trends. Various aspects of this process have been illustrated in my book Protecting The Pig: How Stock Market Trends Reveal the Way to Grow and Preserve Your Wealth.
The S&P 500 Index is one of the most commonly followed equity indices, and many consider it one of the best representations of the U.S. stock market, and a bellwether for the U.S. economy. It is comprised of 500 large companies having common stock listed on the NYSE or NASDAQ. The volatility (beta) of the account may be greater or less than the index. It is not possible to invest directly in this index.
Technical analysis is a method of evaluating securities by analyzing statistics generated by market activity, such as past prices and volumes. Technical analysis attempts to predict a future stock price or direction based on market trends. The assumption is that the market follows discernible patterns and if these patterns can be identified then a prediction can be made. The risk is that markets may not always follow patterns. There are certain limitations to technical analysis research, such as the calculation results being impacted by changes in security price during periods of market volatility. Technical analysis is one of many indicators that may be used to analyze market data for investing purposes and should not be considered a guaranteed prediction of market activity. The opinions expressed are those of BLI. The opinions referenced are as of the date of publication and are subject to change without notice. BLI reserves the right to modify its current investment strategies based on changing market dynamics or client needs.
Past performance is not indicative of future results. This material is not financial advice or an offer to sell any product. The information contained herein should not be considered a recommendation to purchase or sell any particular security. Forward-looking statements cannot be guaranteed.
Guardian Wealth Advisors, LLC (“GWA”) is an investment adviser registered with the U.S. Securities and Exchange Commission. Registration does not imply a certain level of skill or training. More information about GWA’s investment advisory services can be found in its Form CRS or Form ADV Part 2, which is available upon request.
GWA-23-87

