
A client recently expressed concern over what she was hearing through the media, and how the stock market could drop by 40% if certain circumstances came to pass. My response was simple and straightforward: Ignore the media and people’s opinions. Pay attention to what the market is suggesting instead. This is the purpose of these monthly updates: to show you what I believe the market is telling us based on over 95 years of stock market history, which dictates investment strategy decisions
In last month’s update, I illustrated how we can view the current investment posture of the S&P 500 Index from the perspective of trends. I layered what I believe is a secondary sideways trend within a primary rising trend. The following chart that was introduced last month has been updated through the end of May.
THE S&P 500 PRIMARY Trend: RISING;
SECONDARY Trend: SIDEWAYS
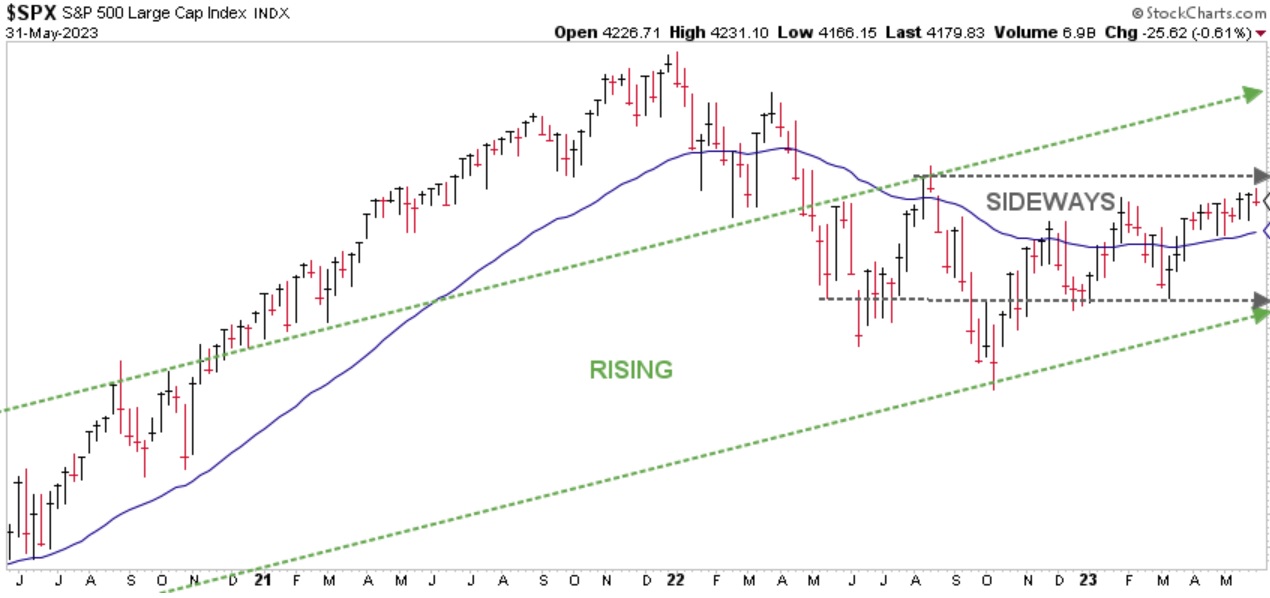
Chart courtesy of StockCharts.com
Last month I made the following statement based on this chart:
- Prices need to rise above and remain above the top, gray-dashed line however, for us to see new highs sooner rather than later. Otherwise, any new highs may not materialize until sometime in 2024, or even 2025, if at all.
At the time I am writing this, the S&P is testing the top, gray-dashed line. The reason I believe this is an important moment is the outcome should set our expectations as investors for the coming months.
If price can break out above the top, gray-dashed line, then I would expect prices to continue to rise to the top, green-dashed line (which happens to be the top of the primary trend channel). In other words, it becomes possible that the S&P could even reach new price highs by the end of this year or early next.
However, if price fails to break out above the top, gray-dashed line, it creates the opportunity for the S&P to experience what could become a short-term price correction where price declines to test the bottom, gray-dashed line (near the intersection of the lower, rising, green-dashed line).
With all that said, here’s the good news. Based on what I am observing in current patterns and trends, and showing you in these charts, I believe the likelihood of a 40% stock market decline anytime soon is slim to none.
THE “BLUE LINE”: A CLOSER LOOK
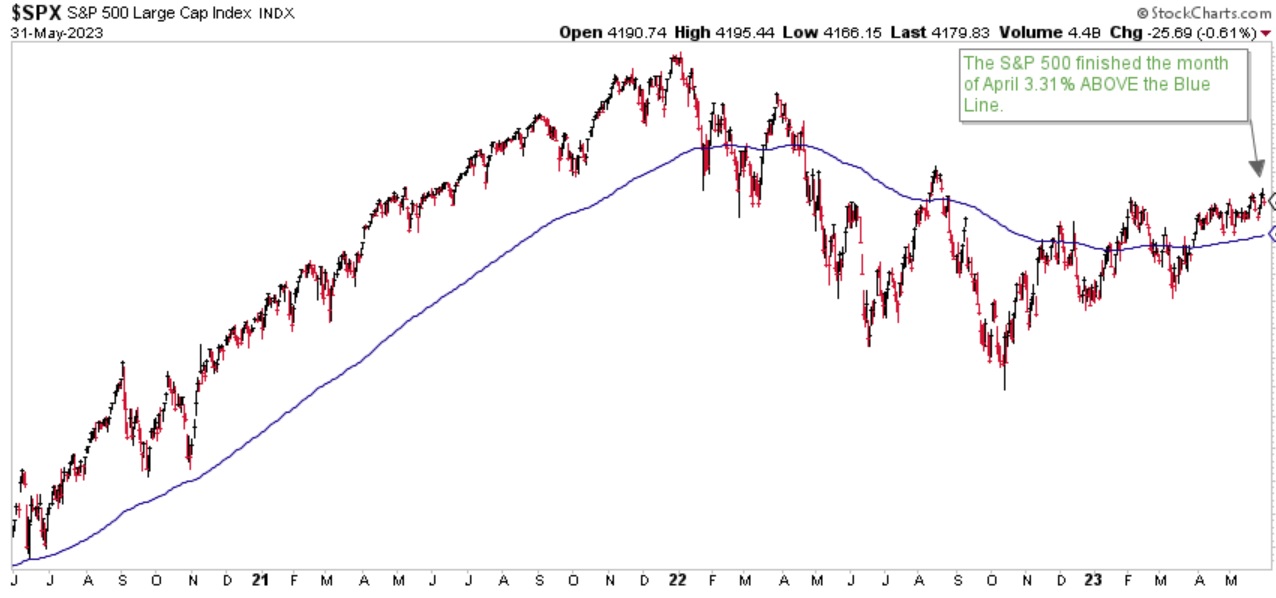
Chart courtesy of StockCharts.com
The S&P finished the month of May 3.31% above the Blue Line, compared to 3.68% above the Blue Line at the end of April. If the S&P remains above the Blue Line, I do not believe there is any reason for investors to be concerned.
Thank you for reading this update and for your continued trust and confidence. Please do not hesitate to call me with any questions at (833) 258-2583.
Jeff Link, Founder
Disclaimers:
The BLUE LINE INVESTING® (BLI) investment process was founded on over 95 years of stock market history. It seeks to identify and align investment decisions with multiyear trends. Various aspects of this process have been illustrated in my book Protecting The Pig: How Stock Market Trends Reveal the Way to Grow and Preserve Your Wealth.
The S&P 500 Index is one of the most commonly followed equity indices, and many consider it one of the best representations of the U.S. stock market, and a bellwether for the U.S. economy. It is comprised of 500 large companies having common stock listed on the NYSE or NASDAQ. The volatility (beta) of the account may be greater or less than the index. It is not possible to invest directly in this index.
Technical analysis is a method of evaluating securities by analyzing statistics generated by market activity, such as past prices and volumes. Technical analysis attempts to predict a future stock price or direction based on market trends. The assumption is that the market follows discernible patterns and if these patterns can be identified then a prediction can be made. The risk is that markets may not always follow patterns. There are certain limitations to technical analysis research, such as the calculation results being impacted by changes in security price during periods of market volatility. Technical analysis is one of many indicators that may be used to analyze market data for investing purposes and should not be considered a guaranteed prediction of market activity. The opinions expressed are those of BLI. The opinions referenced are as of the date of publication and are subject to change without notice. BLI reserves the right to modify its current investment strategies based on changing market dynamics or client needs.
Past performance is not indicative of future results. This material is not financial advice or an offer to sell any product. The information contained herein should not be considered a recommendation to purchase or sell any particular security. Forward looking statements cannot be guaranteed.
Guardian Wealth Advisors, LLC (“GWA”) is an investment adviser registered with the U.S. Securities and Exchange Commission. Registration does not imply a certain level of skill or training. More information about GWA’s investment advisory services can be found in its Form CRS or Form ADV Part 2, which is available upon request.
GWA-23-49

