
Last month I shared an investing secret by using scenes from the movie TOP GUN: MAVERICK (2022). If you read the article, it is more than likely you may have been highly skeptical of my comments (that is, unless you are an existing client or have already read my book). If so, I completely understand. Most Investment Professionals (IP) in the industry sound pretty much the same, so when someone comes along and suggests a strategy for consideration that is “out in left field” so to speak, it’s easy to dismiss it. But please consider, everybody knew that no one could run a sub-4-minute mile until Roger Bannister did it in 1952.
I want to assure anyone who reads this article that the foundation for my prior article is based on the wise words spoken by the Oracle of Omaha himself–Warren Buffett.
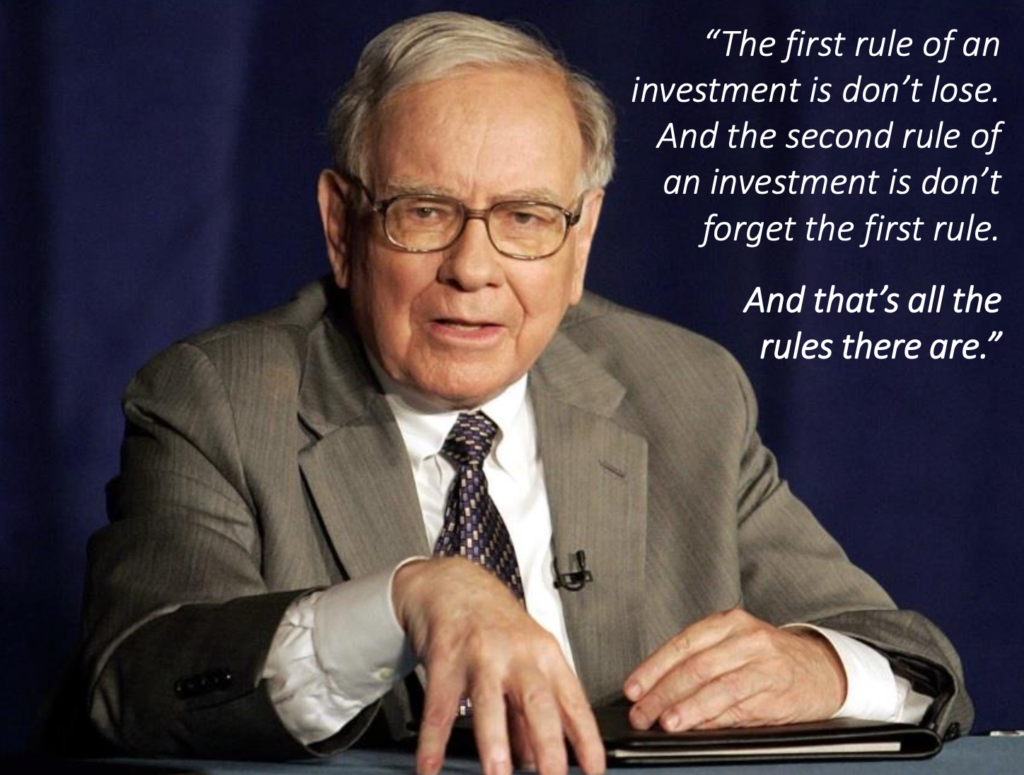
Such wisdom, but sadly, very few take it to heart. For instance, a couple years back I was going through an initial due-diligence call with an investment firm out of Texas that at the time was managing $4.4 Billion of client money. The first and only question I asked them was, “What is your risk management strategy?” The cliff notes version of their answer–they didn’t have one! In other words, when this rising stock market trend eventually comes to an end, should history repeat, they and their clients will ride the stock market roller coaster straight down.
For decades, many IP’s have focused their efforts on trying to find the next Microsoft, Amazon, or Nvidia. But what they tend to neglect is helping protect their clients against significant loss on the downside. This is where I chose to devote my attention and cultivate my expertise following the second major stock market meltdown of my career that took place in 2008.
The average investor is someone who I believe is trying to improve their standard of living, save for retirement, help pay for their children’s college (if they have children), and enjoy an occasional family vacation or two. For such people, it is going to be a rarity if they find the next Bitcoin or Nvidia, and even if they do, in hindsight will never have bought enough. However, it is highly probable that they will experience one, two, or even three significant stock market meltdowns throughout their investing lifetime. So, my question is, what is a more effective course of action for such people? I believe the answer is found in the following chart.
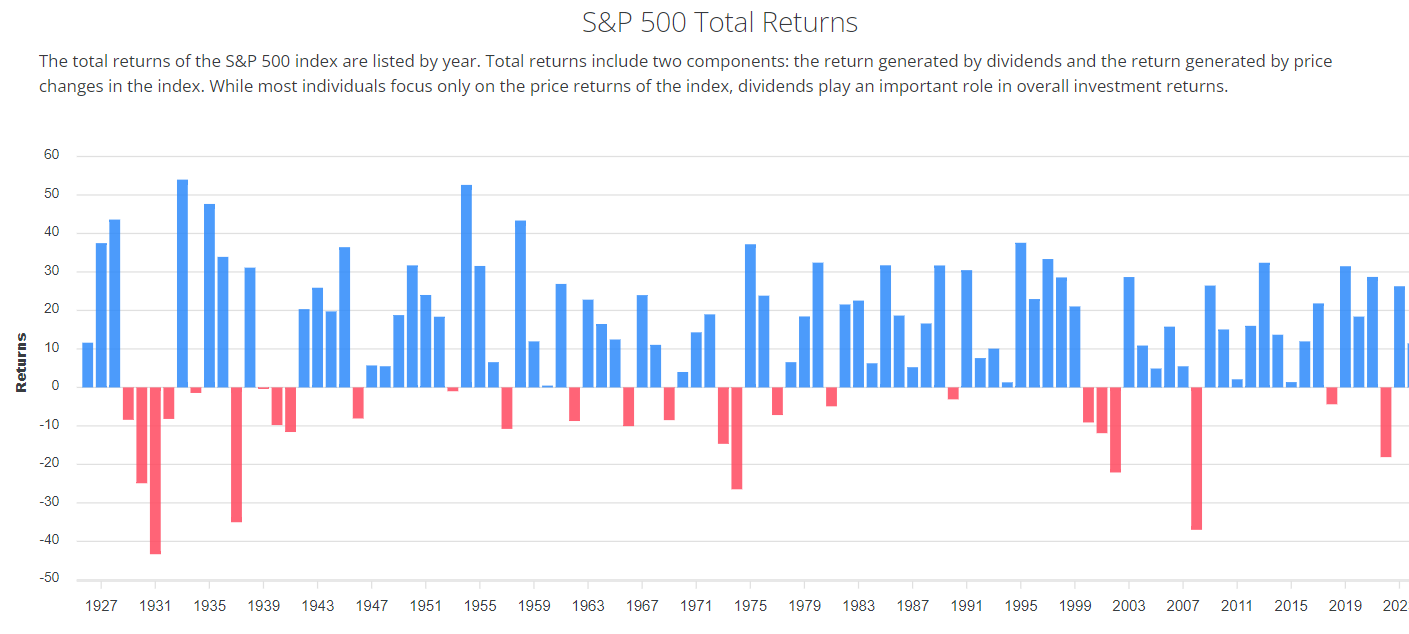
Source: Slickcharts.com (1925 – 2023)
The blue bars represent positive stock market returns for the S&P 500 Index (measured by calendar year). The red bars represent negative stock market returns. Few investors suffer financially from gains (blue bars), but many investors suffer financially from losses (red bars). So instead of trying to find the next hot stock, why not index most of your portfolio and passively enjoy the gains during the blue bar years, and focus your energy and attention on how to attempt to neutralize, or on the rare occasion, profit from the red bar years? After all, what wisdom did Michael Jordan give us?

“Take a negative and turn it into a positive.” As it pertains to investing, how exactly do we attempt to do that? Since I literally wrote the book on this, and provided examples, I won’t go into any of the details in this article. But I will say this: if there was one investment (gamble) I could make so that I could be confident would pay out every single time, it would be milk and eggs.
I reside in the one of the southern states in the United States. When a severe winter storm is forecast that could cause schools and businesses to close, and roads to be impassable for a few days or more, everyone rushes to the store and buys up all the milk and eggs (and sometimes gasoline at the pump). This is a psychological behavior based on expectations, and believe it or not, such behavior exists in the stock market. Being able to recognize when such behavior could be manifesting is the lynchpin to being able to follow Michael’s (and Warren’s) words to attempt to take a negative and turn it into a positive.
The BLUE LINE INVESTING® investment process is designed to help all investors at all ages, and I have found the people who tend to benefit most are 50-65 years old, have financial investments in the $500,000-$5,000,000 range, and who want to continue growing their wealth in a risk-managed and tax-efficient way. If you or someone you know fits some or all these attributes, please reach out. At the time of this writing, I have the capacity to help people who fit this profile or come close to it.
STOCK MARKET, THE TREND:
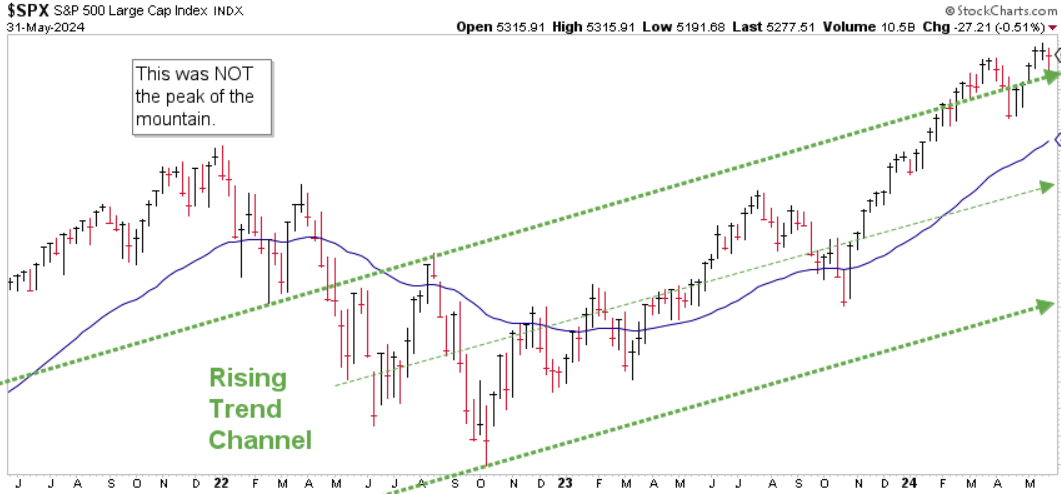
Chart courtesy of StockCharts.com
Based on the updated price chart above, the S&P is “dancing” in and out of the top of the rising trend channel. Based on the various indicators followed by my process, I believe the U.S. stock market is sending mixed messages. My views are neither positive or negative on the market at this time, but rather neutral.
STOCK MARKET, WATCHING FOR THE SUMMIT:
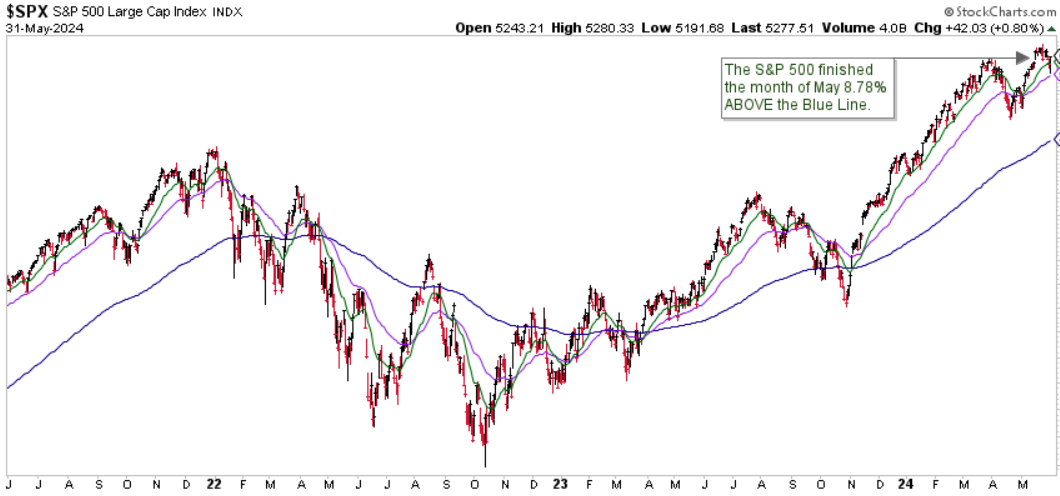
Chart courtesy of StockCharts.com
The S&P finished the month of May 8.78% above the Blue Line, compared to being 5.89% above the Blue Line at the end of April. So far, the possible price correction I referenced last month has not come to fruition…at least not yet. Thank you for your continued trust and support.
Jeff Link
Disclaimers:
The BLUE LINE INVESTING® (BLI) investment process was founded on over 95 years of stock market history. It seeks to identify and align investment decisions with multiyear trends. Various aspects of this process have been illustrated in my book Protecting The Pig: How Stock Market Trends Reveal the Way to Grow and Preserve Your Wealth.
The S&P 500 Index is one of the most commonly followed equity indices, and many consider it one of the best representations of the U.S. stock market, and a bellwether for the U.S. economy. It is comprised of 500 large companies having common stock listed on the NYSE or NASDAQ. The volatility (beta) of the account may be greater or less than the index. It is not possible to invest directly in this index.
Technical analysis is a method of evaluating securities by analyzing statistics generated by market activity, such as past prices and volumes. Technical analysis attempts to predict a future stock price or direction based on market trends. The assumption is that the market follows discernible patterns and if these patterns can be identified then a prediction can be made. The risk is that markets may not always follow patterns. There are certain limitations to technical analysis research, such as the calculation results being impacted by changes in security price during periods of market volatility. Technical analysis is one of many indicators that may be used to analyze market data for investing purposes and should not be considered a guaranteed prediction of market activity. The opinions expressed are those of BLI. The opinions referenced are as of the date of publication and are subject to change without notice. BLI reserves the right to modify its current investment strategies based on changing market dynamics or client needs.
Past performance is not indicative of future results. This material is not financial advice or an offer to sell any product. The information contained herein should not be considered a recommendation to purchase or sell any particular security. Forward-looking statements cannot be guaranteed.
Guardian Wealth Advisors, LLC (“GWA”) is an investment adviser registered with the U.S. Securities and Exchange Commission. Registration does not imply a certain level of skill or training. More information about GWA’s investment advisory services can be found in its Form CRS or Form ADV Part 2, which is available upon request.
GWA-24-41


