
In my two prior monthly updates, I referenced a past client named “Don” who chose to self-manage his investment accounts. In those updates I alluded to my belief that he increased his exposure to technology stocks anticipating continued above-average returns (at least for the short-term). Will he be rewarded for his decision during his window of time? Time will tell, but let’s take note of a few observations of the current U.S. stock market.
First, the S&P 500 Index continues to remain top heavy. The top five stocks (1%) account for 25% of the entire index, and all five are in the technology industry.
Second, the price of the S&P 500 Index is currently 10% above its BLUE LINE. While this does not provide a measure of valuation per se, it does warn that the margin of safety for new investments may prove poor for people who choose to buy in at current prices.
Third, there continues to be a divergence taking place between the big three U.S. indices. While the media continues to reference new “highs” in the stock market, so far this has taken place in the DJIA and S&P 500. So far, the technology heavy NASDAQ has failed to exceed its July high.
What does all this mean? Frankly, not too much. They are just observations, and overvalued markets can remain overvalued for a long time. Further, it could be any day that the NASDAQ makes a new high, validating the continued rising trend. But as I shared on a past episode of Talking Wealth, my goal for these observations is to increase the probability of finding warning signs of pending stock market losses before they manifest into significant investment losses.
In my book, Protecting The Pig, I illustrated the three types of price risk I believe investors should always be looking for. In terms of increasing magnitude of investment loss, they are a Price Correction (8-12%), a Channel Correction (20-35%), and a Trend Correction(50%+). As I wrote in chapter 5 titled The “Faces” of Risk, what took place in July was in hindsight a Price Correction.
A price correction consists of a relatively short-lived decline in the price of an investment. After the price decline comes to an end, the price typically recovers and rises higher. (Pg 48)
You may notice the price of the DJIA tended to decline to its Blue Line on price corrections before “bouncing” off it and rising higher over the next few months. With price corrections, the decline tends to be relatively shallow and short lived. (Pg 49)
Consider what took place since July in the following chart of the S&P.
STOCK MARKET, THE TREND:
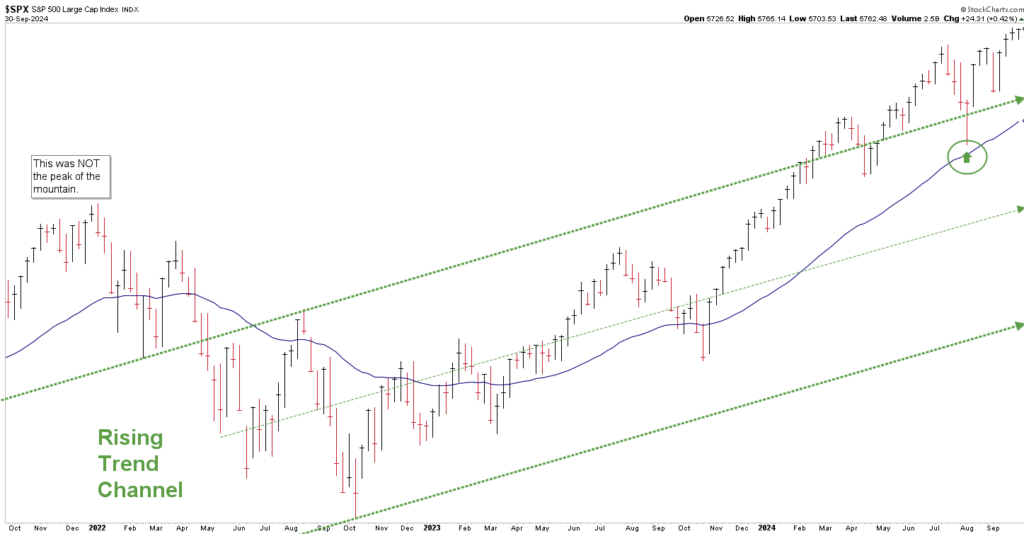
Chart courtesy of StockCharts.com
The price of the S&P declined to its Blue Line, “bounced” off it, and has since recovered to new highs (please refer to the point on the chart with the circled green arrow). Historically, price corrections can take place once or twice per year and tend to be buying opportunities (at least for the short-term).
Historically, however, a price correction will eventually precede a Channel Correction (like 2021-2022) which lasts longer and results in more significant losses. And the occasional Channel Correction can manifest into a Trend Correction (like 2007-2008), which tends to last up to three years with average losses of 50% from beginning to end.
The observations referenced in the beginning of this update serve as a small sample of potential warning signs to look for before stock markets suffer significant losses. As more warning signs manifest around the same time, history suggests an increasing probability that investment losses are forthcoming.
STOCK MARKET, WATCHING FOR THE SUMMIT:
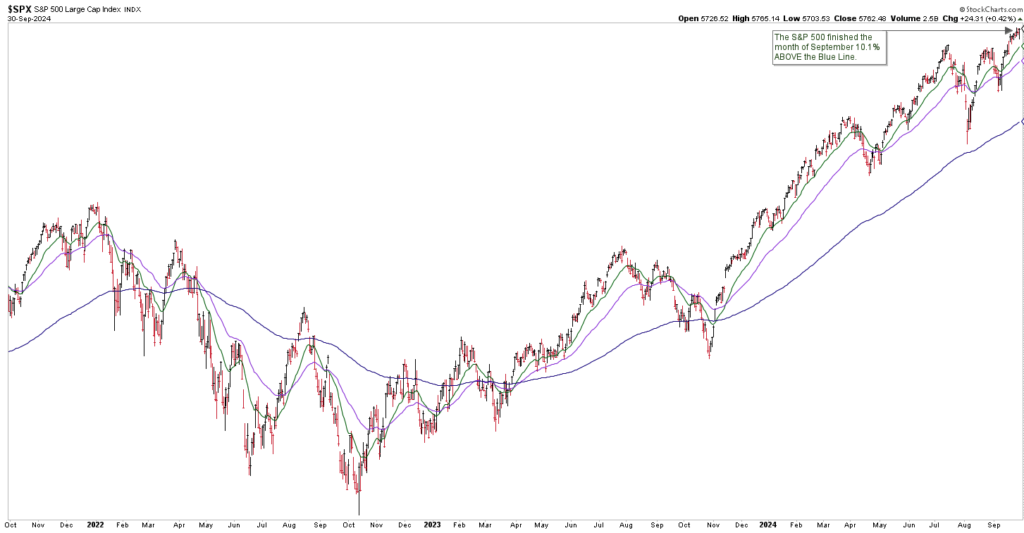
Chart courtesy of StockCharts.com
The S&P finished the month of September 10.1% above the Blue Line, compared to being 9.71% above the Blue Line at the end of August. Thank you for reading this update and please feel free to reach out with any questions.
Jeff Link
Disclaimers:
The BLUE LINE INVESTING® (BLI) investment process was founded on over 95 years of stock market history. It seeks to identify and align investment decisions with multiyear trends. Various aspects of this process have been illustrated in my book Protecting The Pig: How Stock Market Trends Reveal the Way to Grow and Preserve Your Wealth.
The S&P 500 Index is one of the most commonly followed equity indices, and many consider it one of the best representations of the U.S. stock market, and a bellwether for the U.S. economy. It is comprised of 500 large companies having common stock listed on the NYSE or NASDAQ. The volatility (beta) of the account may be greater or less than the index. It is not possible to invest directly in this index.
Technical analysis is a method of evaluating securities by analyzing statistics generated by market activity, such as past prices and volumes. Technical analysis attempts to predict a future stock price or direction based on market trends. The assumption is that the market follows discernible patterns and if these patterns can be identified then a prediction can be made. The risk is that markets may not always follow patterns. There are certain limitations to technical analysis research, such as the calculation results being impacted by changes in security price during periods of market volatility. Technical analysis is one of many indicators that may be used to analyze market data for investing purposes and should not be considered a guaranteed prediction of market activity. The opinions expressed are those of BLI. The opinions referenced are as of the date of publication and are subject to change without notice. BLI reserves the right to modify its current investment strategies based on changing market dynamics or client needs.
Past performance is not indicative of future results. This material is not financial advice or an offer to sell any product. The information contained herein should not be considered a recommendation to purchase or sell any particular security. Forward-looking statements cannot be guaranteed.
Guardian Wealth Advisors, LLC (“GWA”) is an investment adviser registered with the U.S. Securities and Exchange Commission. Registration does not imply a certain level of skill or training. More information about GWA’s investment advisory services can be found in its Form CRS or Form ADV Part 2, which is available upon request.
GWA-24-77

