
April proved to be a “fun” and opportunistic month for the stock market. Given recent volatility this trend update will run slightly longer than normal. First, I want to share a paragraph that I provided to clients in my April 8th Special Report. I said:
While it is always possible the market could decline further, I don’t currently expect that. At least not in a material amount. The reason why is found within the following chart of the S&P 500 Index. This chart spans 20 years and at the top is an economic indicator called RSI, which stands for Relative Strength Indicator. What you will notice is that over the past twenty years there have only been 7 times (including the present) when this indicator has touched or declined below 30 (the solid horizontal green line). In each case, these proved to be price lows, or stated another way, buying opportunities.
By following the BLUE LINE INVESTINGÒ investment process, this did turn out to be a buying opportunity for many clients who had money sitting on the sidelines over the past several months. In the short-term, that is the good news. However, there is potential bad news that we need to monitor over the coming weeks and months. It took me a few days, but I believe I have identified the outer “bounds” of what could prove to be the 2025 Channel Correction I have been writing about in recent months.
STOCK MARKET, THE TREND:
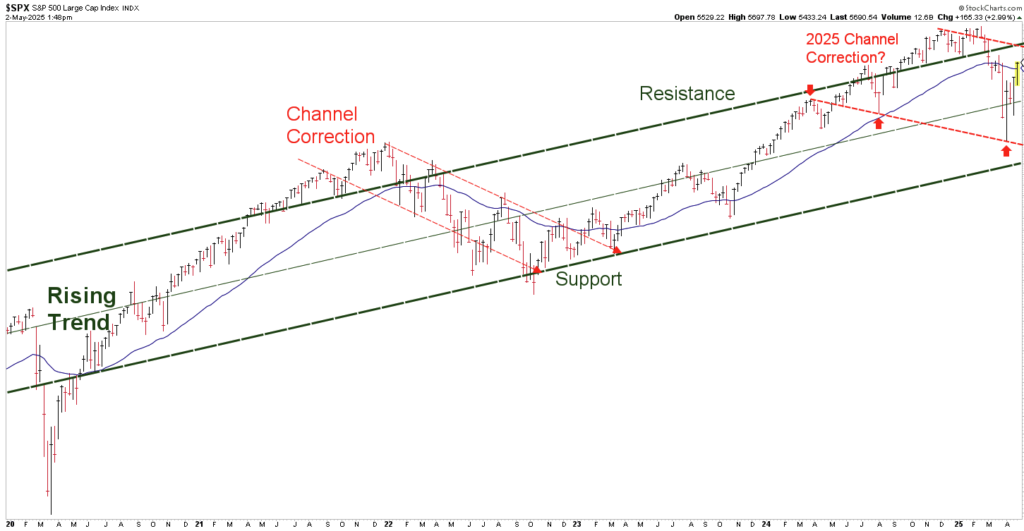
Chart courtesy of StockCharts.com, Data as of 4/30/25
Please refer first to the Channel Correction in the middle of the chart. That one took place in 2022, unfolded over 9-10 months, and resulted in losses of approximately 25% from high to low. Looking at the upper, right-hand corner of the chart you can see the potential outer “bounds” of a Channel Correction identified by the downward sloping red-dashed lines. There is both good news and bad news going forward if this unfolds as currently illustrated.
First, the good news. Like the Channel Correction of 2022, I would expect this one to remain within the green-dashed rising trend channel. As long as the S&P remains at or above the bottom, green-dashed line, the current rising trend channel will remain intact, and I expect to eventually see new all-time highs.
However, the potential “bad” news is that the current price rally is heading towards a crossover of the top red-dashed and green-dashed lines. If, and I mean IF price is not able to rise above and remain above that intersection, then that may be the reaction high for this price rally. Thereafter, we should expect stock prices to resume their decline. If this unfolds, my investment process will be followed by increasing the percentage of inverse Exchange-Traded Funds (ETFs) in client accounts. The purpose of this is to further hedge, or protect, client account values by attempting to limit dollar-for-dollar losses thereafter.
This recent, short-term price rally may prove to be a “suckers rally” to get investors to jump in late before the market tops out once again and before resuming the potential 2025 Channel Correction. I want to remind both clients and readers that while this is what I am currently monitoring and expecting, I will change my thoughts and expectations as the market provides new information.
STOCK MARKET, WATCHING FOR THE SUMMIT:
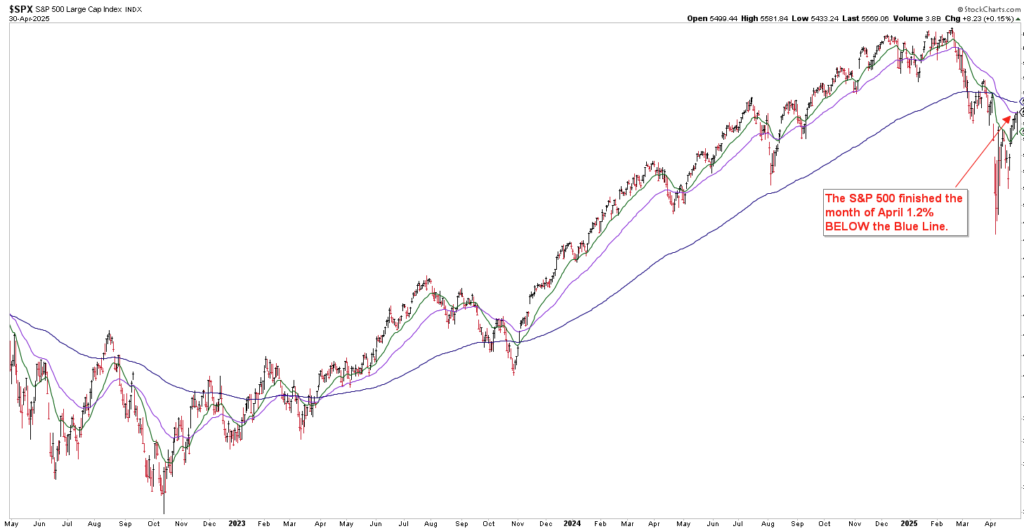
Chart courtesy of StockCharts.com, Data as of 4/30/25
The S&P finished the month of April 1.4% below the Blue Line, compared to being 1.7% below the Blue Line at the end of March.
For anyone who has not read my book, Protecting The Pig, these concepts are covered in chapters five and seven. I encourage you to buy a copy and learn what you may not currently know to be better prepared for the risks that are likely to manifest in the coming years. Alternatively, I currently have capacity for a few select new clients, so if you have need or interest please feel free to contact me at (833) 258-2583.
Jeff Link
Disclaimers:
The BLUE LINE INVESTING® (BLI) investment process was founded on over 95 years of stock market history. It seeks to identify and align investment decisions with multiyear trends. Various aspects of this process have been illustrated in my book Protecting The Pig: How Stock Market Trends Reveal the Way to Grow and Preserve Your Wealth.
The S&P 500 Index is one of the most commonly followed equity indices, and many consider it one of the best representations of the U.S. stock market, and a bellwether for the U.S. economy. It is comprised of 500 large companies having common stock listed on the NYSE or NASDAQ. The volatility (beta) of the account may be greater or less than the index. It is not possible to invest directly in this index.
Technical analysis is a method of evaluating securities by analyzing statistics generated by market activity, such as past prices and volumes. Technical analysis attempts to predict a future stock price or direction based on market trends. The assumption is that the market follows discernible patterns and if these patterns can be identified then a prediction can be made. The risk is that markets may not always follow patterns. There are certain limitations to technical analysis research, such as the calculation results being impacted by changes in security price during periods of market volatility. Technical analysis is one of many indicators that may be used to analyze market data for investing purposes and should not be considered a guaranteed prediction of market activity. The opinions expressed are those of BLI. The opinions referenced are as of the date of publication and are subject to change without notice. BLI reserves the right to modify its current investment strategies based on changing market dynamics or client needs.
Past performance is not indicative of future results. This material is not financial advice or an offer to sell any product. The information contained herein should not be considered a recommendation to purchase or sell any particular security. Forward-looking statements cannot be guaranteed.
Guardian Wealth Advisors, LLC (“GWA”) is an investment adviser registered with the U.S. Securities and Exchange Commission. Registration does not imply a certain level of skill or training. More information about GWA’s investment advisory services can be found in its Form CRS or Form ADV Part 2, which is available upon request.
GWA-25-45


