
In last month’s update, I pointed out that the S&P 500 may be preparing for a future Channel Correction. This type of correction is what I consider “medium-term” risk. When it manifests, it historically results in temporary loses of about 20-35% from the high to the low. Further, the amount of time that it typically takes to go from the high, to the low, and back to new all-time highs is about two years. Based on current and unfolding global events, it wouldn’t exactly be surprising if this type of correction eventually unfolds.
The chart below has been updated from last month’s update to reflect the most recent stock market behavior. Over the past several months the S&P has been testing or bouncing off the top resistance channel (which is identified by the three green arrows within the green circle at the top right). When this behavior pattern is compared to the behavior pattern that preceded the 2022 Channel Correction, we notice it is very similar. Can you see it?
STOCK MARKET, THE TREND:
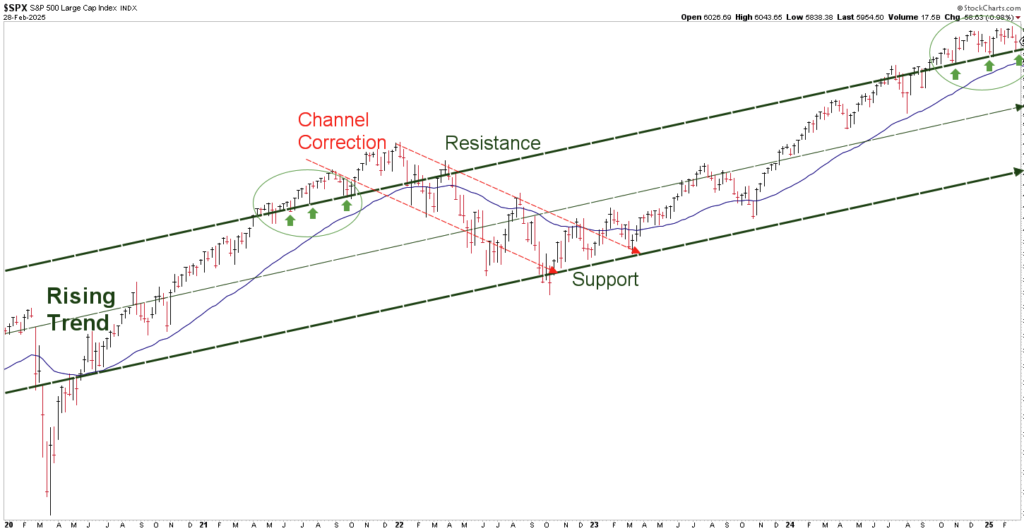
Chart courtesy of StockCharts.com
As of the end of February, the top green line is providing support for the S&P. The real question is, Will it hold? If it doesn’t hold now, or over the weeks or months ahead, another Channel Correction could manifest. For BLUE LINE INVESTING® clients, this should be welcomed! After all, our desire should be to follow Michael Jordan’s advice which is to, “take a negative and turn it into a positive.”
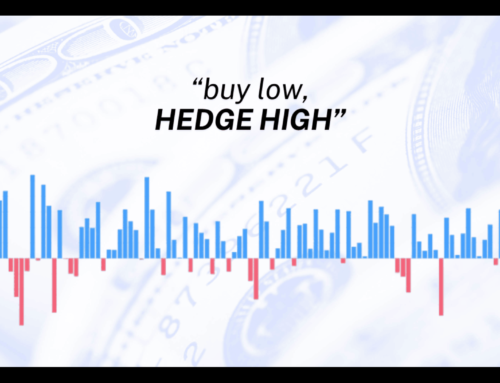
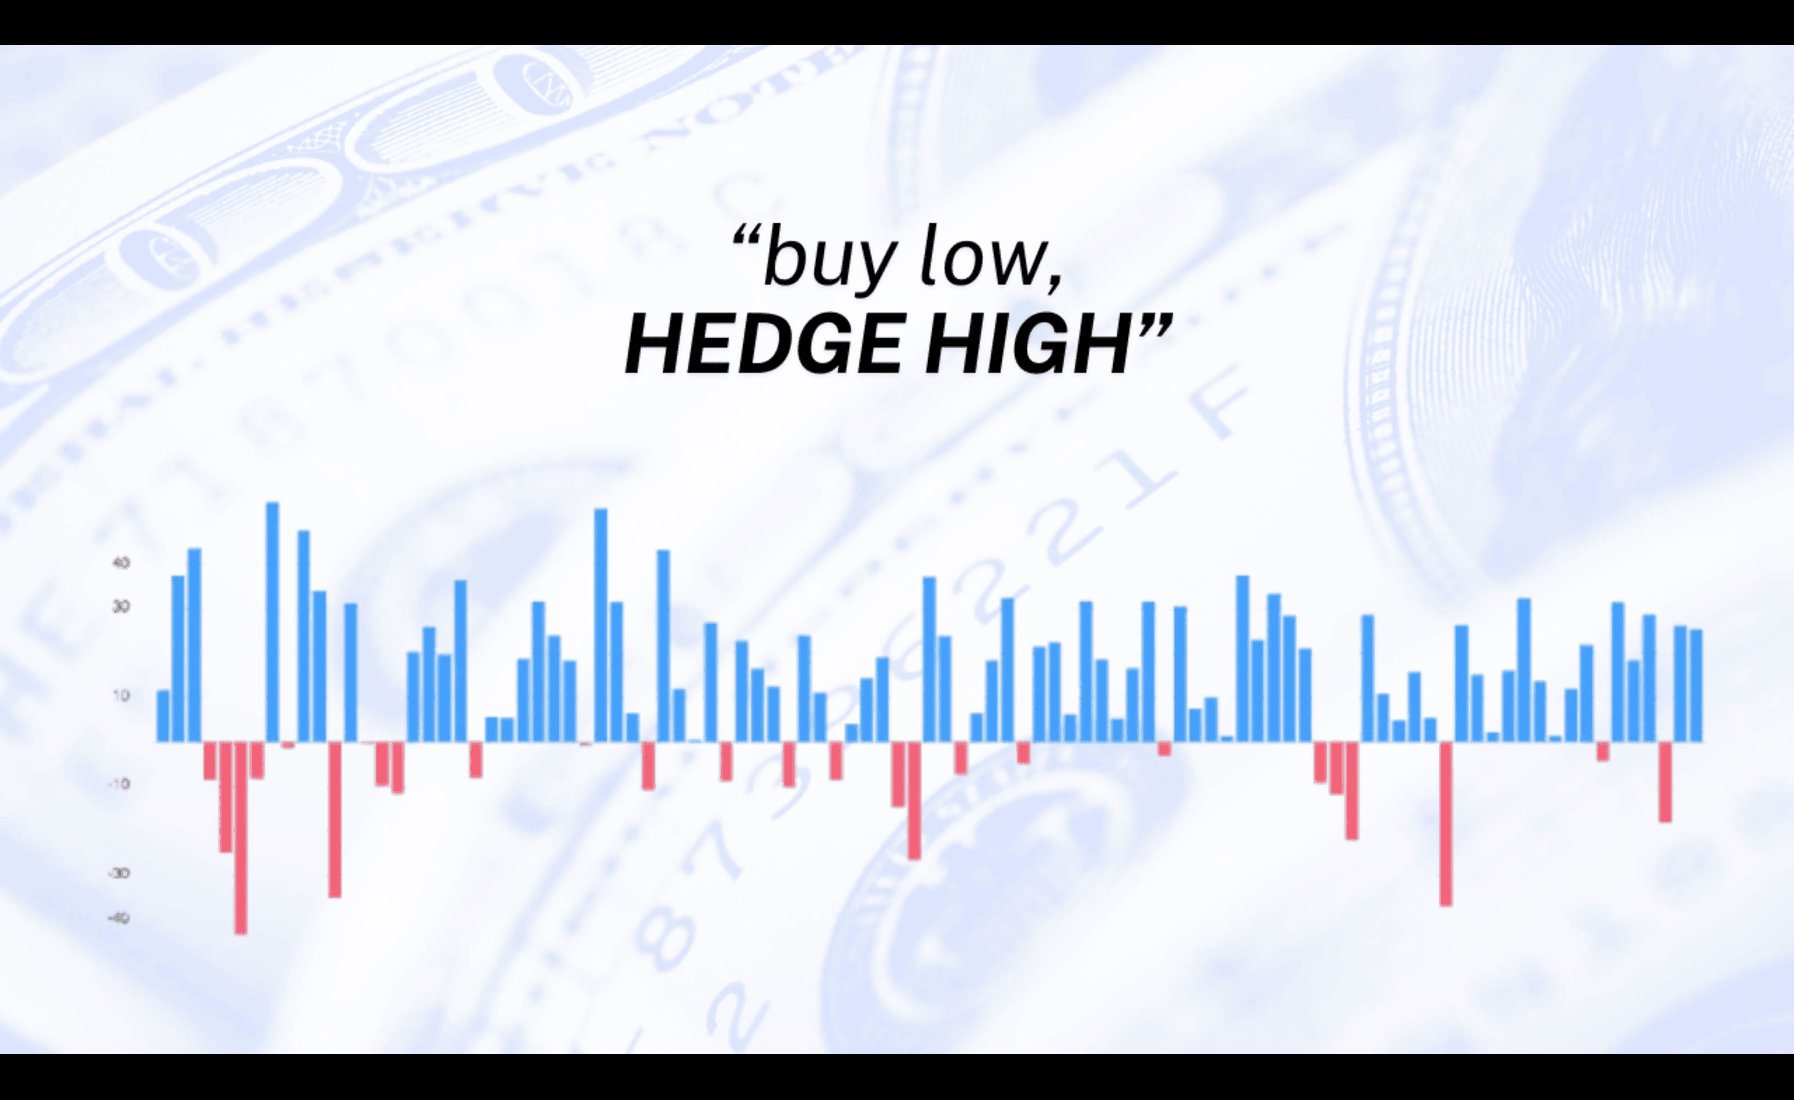
I believe one of the best ways to attempt to do this is to apply the Buy Low, Sell High investment strategy, but with a twist. Instead of selling at the high, investors should attempt to hedge, or protect, their investments near the high. As I illustrated in Chapter 7 of my book, Protecting The Pig, this is where inverse Exchange-Traded Funds can prove beneficial. This does require timing decisions, but that’s why we let the market tell us when the best time may be to make such decisions. We must never rely on our own emotions or beliefs.
If price falls below the green line, and remains below it over the weeks or months ahead, the odds of a Channel Correction will steadily improve. If price eventually declines all the way down to the lower green line (“Support”), it would result in about a 23% correction from here. This would fall within historical expectations and could provide an attractive buying opportunity for investors who prepared in advance and Hedged High.
There is one question I want to ask you to consider as you reflect on what I am sharing with you. My question is, what does an investors age have anything to do with making investment decisions with regard to the prevailing trend of the stock market? This will be explored in more detail in an upcoming 7 part article series beginning later this month.
STOCK MARKET, WATCHING FOR THE SUMMIT:

Chart courtesy of StockCharts.com
The S&P finished the month of February 4.4% above the BLUE LINE, compared to being 7.2% above the Blue Line at the end of January. With price remaining above the BLUE LINE, there is no need for concern…at least not yet.
Jeff Link
Disclaimers:
The BLUE LINE INVESTING® (BLI) investment process was founded on over 95 years of stock market history. It seeks to identify and align investment decisions with multiyear trends. Various aspects of this process have been illustrated in my book Protecting The Pig: How Stock Market Trends Reveal the Way to Grow and Preserve Your Wealth.
The S&P 500 Index is one of the most commonly followed equity indices, and many consider it one of the best representations of the U.S. stock market, and a bellwether for the U.S. economy. It is comprised of 500 large companies having common stock listed on the NYSE or NASDAQ. The volatility (beta) of the account may be greater or less than the index. It is not possible to invest directly in this index.
Technical analysis is a method of evaluating securities by analyzing statistics generated by market activity, such as past prices and volumes. Technical analysis attempts to predict a future stock price or direction based on market trends. The assumption is that the market follows discernible patterns and if these patterns can be identified then a prediction can be made. The risk is that markets may not always follow patterns. There are certain limitations to technical analysis research, such as the calculation results being impacted by changes in security price during periods of market volatility. Technical analysis is one of many indicators that may be used to analyze market data for investing purposes and should not be considered a guaranteed prediction of market activity. The opinions expressed are those of BLI. The opinions referenced are as of the date of publication and are subject to change without notice. BLI reserves the right to modify its current investment strategies based on changing market dynamics or client needs.
Past performance is not indicative of future results. This material is not financial advice or an offer to sell any product. The information contained herein should not be considered a recommendation to purchase or sell any particular security. Forward-looking statements cannot be guaranteed.
Guardian Wealth Advisors, LLC (“GWA”) is an investment adviser registered with the U.S. Securities and Exchange Commission. Registration does not imply a certain level of skill or training. More information about GWA’s investment advisory services can be found in its Form CRS or Form ADV Part 2, which is available upon request.
GWA-25-24

