About a year ago I was referred a potential client, and by the time my name was added to the mix, they had already met with three or four other investment professionals. Even though they had narrowed the field down to one, the referrer urged them to talk with me. We met shortly thereafter and to my pleasant surprise, I discovered they had bought and read a copy of my book the weekend before our meeting. About a week later they contacted me to let me know they wanted to use the BLUE LINE INVESTING® investment process, which unlike the other considerations seeks to actively protect against the downside.
Why do I choose to focus on attempting to limit the downside? The reason for this is two-fold. First, if possible, I never want my clients or myself to suffer the negative consequences of another stock market “crash”. Second, while investment professionals like me can always “find” a new client, if my clients suffer significant investment loss, they may not be able to go out and easily “find” more money. With this perspective I made it my mission to learn what I had been ignorant about up to that point in my career to attempt to be better prepared for future “crashes.”
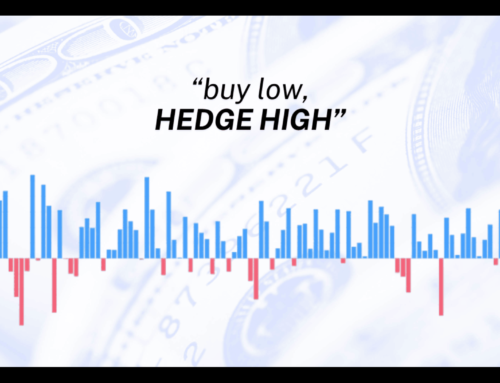
Since the stock market “crashes” of 2000-2002 and 2007-2009, I have spent my career studying, learning and monitoring the historical signs that tend to precede significant investment loss. Consider the following calendar year returns for the S&P 500 Index from 1925 through November 2024.

Chart courtesy of Slickcharts.com
The blue bars represent calendar years with positive returns while the red bars represent years with negative returns. For some people, this visual may seem insignificant because over the “long-term” many calendar years have been positive. However, for certain people, the timing of when these negative returns manifest in their individual lifetime can prove detrimental or even catastrophic. So, how beneficial could it be if there was a way to attempt to identify the timing when the blue bars may be transforming into red bars?
In last month’s update, I illustrated the “Blue Line” of my investment process using an example of a clean energy ETF. Over the next several months, I intend on using the S&P to provide additional examples to illustrate how this process seeks to identify changes in investor behavior that have historically accompanied blue bars transforming into red bars.
Michael Jordan said, “Take a negative and turn it into a positive.” Over the coming months, I’ll illustrate how my process attempts to accomplish this. Make sure to “Follow” me or subscribe to my website blog (https://bluelineinvesting.com/blog/) if you don’t want to miss out. Until then, here’s the monthly update of the current stock market trend.
STOCK MARKET, THE TREND:

Chart courtesy of StockCharts.com
The S&P finished the month of November 10.5% above the BLUE LINE, compared to being 6.7% above the Blue Line at the end of October. In other words, its rising trend currently remains intact.
STOCK MARKET, WATCHING FOR THE SUMMIT:
 Chart courtesy of StockCharts.com
Jeff Link
Disclaimers:
The BLUE LINE INVESTING® (BLI) investment process was founded on over 95 years of stock market history. It seeks to identify and align investment decisions with multiyear trends. Various aspects of this process have been illustrated in my book Protecting The Pig: How Stock Market Trends Reveal the Way to Grow and Preserve Your Wealth.
The S&P 500 Index is one of the most commonly followed equity indices, and many consider it one of the best representations of the U.S. stock market, and a bellwether for the U.S. economy. It is comprised of 500 large companies having common stock listed on the NYSE or NASDAQ. The volatility (beta) of the account may be greater or less than the index. It is not possible to invest directly in this index.
Technical analysis is a method of evaluating securities by analyzing statistics generated by market activity, such as past prices and volumes. Technical analysis attempts to predict a future stock price or direction based on market trends. The assumption is that the market follows discernible patterns and if these patterns can be identified then a prediction can be made. The risk is that markets may not always follow patterns. There are certain limitations to technical analysis research, such as the calculation results being impacted by changes in security price during periods of market volatility. Technical analysis is one of many indicators that may be used to analyze market data for investing purposes and should not be considered a guaranteed prediction of market activity. The opinions expressed are those of BLI. The opinions referenced are as of the date of publication and are subject to change without notice. BLI reserves the right to modify its current investment strategies based on changing market dynamics or client needs.
Past performance is not indicative of future results. This material is not financial advice or an offer to sell any product. The information contained herein should not be considered a recommendation to purchase or sell any particular security. Forward-looking statements cannot be guaranteed.
Guardian Wealth Advisors, LLC (“GWA”) is an investment adviser registered with the U.S. Securities and Exchange Commission. Registration does not imply a certain level of skill or training. More information about GWA’s investment advisory services can be found in its Form CRS or Form ADV Part 2, which is available upon request.
GWA-24-90
