Finally! It took almost three months, but the NASDAQ stock index finally made a new closing high at the end of October. The reason this is important is because divergences are one of the hallmarks of a topping stock market, even if only a “temporary top”. As I have written before, this divergence was one of several indicators that warned of the “temporary top” that formed in the stock market in late 2021. While the S&P 500 and Dow were making new highs, the NASDAQ did not (it diverged). This was, according to technical analysis, a warning of potential losses to come.
With all three major U.S. indices now reaching new highs, investors should expect the market to continue its rising trend. However, somewhere in the future this trend will end, and when it does, history suggests a 40%-50% decline thereafter. So even though I don’t expect this to happen anytime soon, I’m going to spend the next several months illustrating how I believe our process can help investors identify the timing when this future event may be in the early stages of unfolding.
In this month’s update I’ll illustrate the price history of a stock exchange-traded fund (ETF) in the clean energy industry to distinguish between “hype” and “trend”. It’s far too easy for investors to get sucked into an investment based on the hype, when it might be better to follow the money instead and make decisions based on the trend. The trend is your friend, and in last month’s update I wrote:
Historically, however, a price correction will eventually precede a Channel Correction (like 2021-2022) which lasts longer and results in more significant losses. And the occasional Channel Correction can manifest into a Trend Correction (like 2007-2008), which tends to last up to three years with average losses of 50% from beginning to end.
Stick with me for a few minutes and I’ll show you what I mean. Let’s look at the Invesco WilderHill Clean Energy ETF, symbol: PBW. This ETF consists of 69 publicly traded companies that operate in the clean energy industry. Clean energy has been hyped for many years, and some investors have likely bought into that hype hoping to cash in on future profits from companies involved in this industry. Had they bought into an investment like this in recent years based on that hype, how has that worked out?
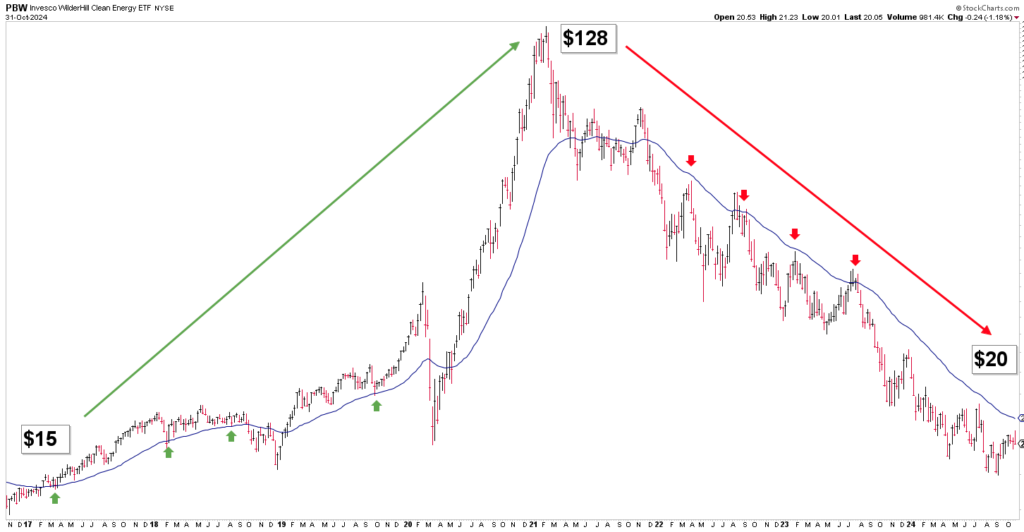
Chart courtesy of StockCharts.com
In early 2017, this investment was priced around $15 per share. Over the next four years, it rose in price to $128, likely garnering much attention. But once the top came, it’s been nothing but losses for the past four years. The price has dropped from $128 to a recent low of $20. For most passive investors who either bought into the hype, or were “sold” on the hype, they have likely experienced losses.
PBW is experiencing what I call a Trend Correction in chapter five of my book, Protecting The Pig. The primary decline has taken place over three years, and the investment losses from the BLUE LINE have exceeded 50%. This is what I expect to eventually happen somewhere in the years ahead when this rising US stock market eventually reaches its final top.
So, how could an investor attempt to limit or avoid such an experience in the future? I want to point out a very simple investment relationship that is illustrated above. During the first four “good” years you will notice that price primarily remained above the BLUE LINE when it was rising. After topping however, as price declined, it primarily remained below the BLUE LINE. Another way of viewing this is that the BLUE LINE tends to act like a floor when prices are rising, but a ceiling when falling.
The reason our process is called BLUE LINE INVESTING is because this is the key indicator we use when selecting investments for purchase. We also use it to monitor those same investments to help with the potential timing to consider selling them. In hindsight, I’m sure you can see how following the trend and avoiding the hype around this investment industry could have proven a beneficial investment decision. For more information, please consider purchasing a copy of my book: Protecting The Pig: How Stock Markets Reveal the Way to Grow and Preserve your Wealth.
Having provided an example of this process, let’s take a look at where the S&P is currently in relation to its own BLUE LINE.
STOCK MARKET, THE TREND:
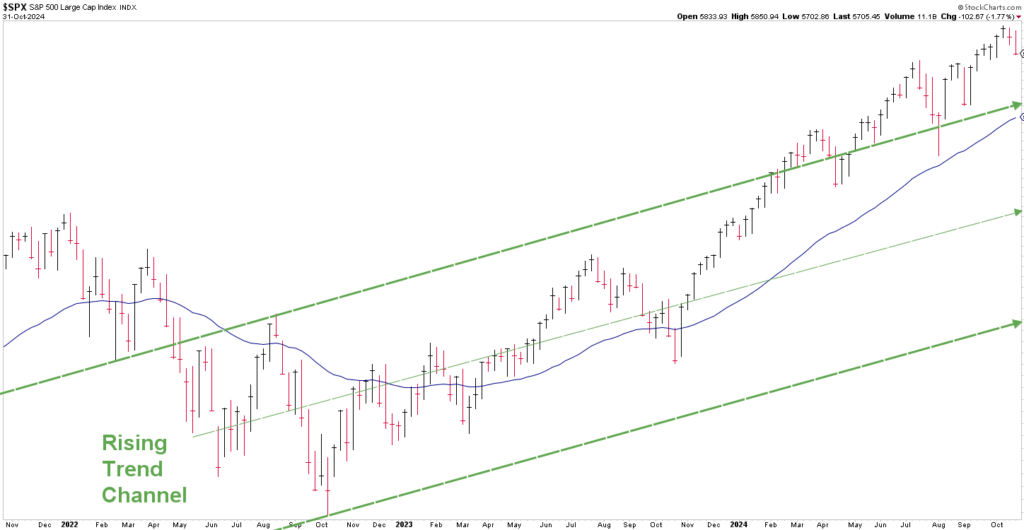
Chart courtesy of StockCharts.com
The S&P finished the month of October 6.7% above the BLUE LINE, compared to being 10.1% above the Blue Line at the end of September. In other words, its rising trend currently remains intact.
STOCK MARKET, WATCHING FOR THE SUMMIT:
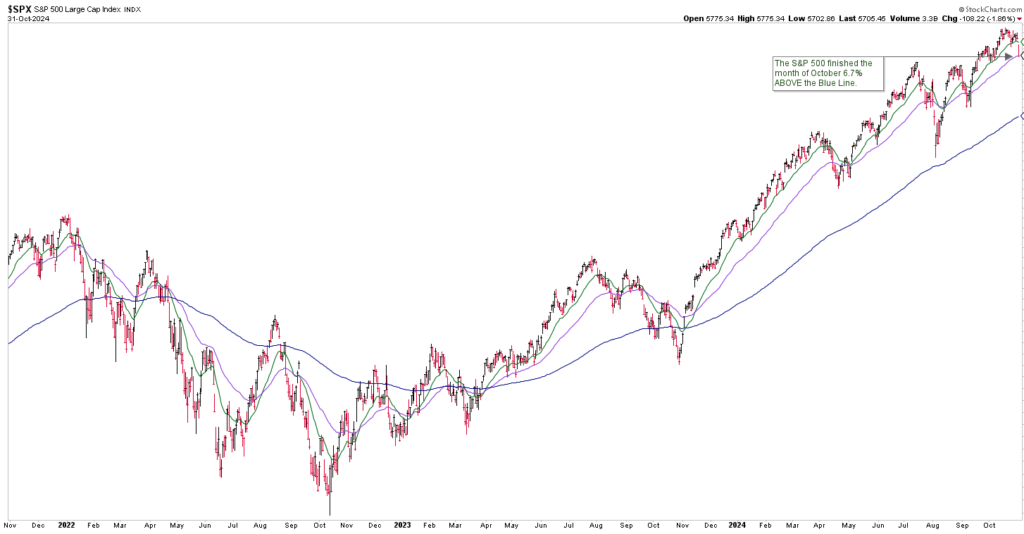
Chart courtesy of StockCharts.com
Thank you for reading this update and please forward it if you believe others could find it beneficial.
Jeff Link
Disclaimers:
The BLUE LINE INVESTING® (BLI) investment process was founded on over 95 years of stock market history. It seeks to identify and align investment decisions with multiyear trends. Various aspects of this process have been illustrated in my book Protecting The Pig: How Stock Market Trends Reveal the Way to Grow and Preserve Your Wealth.
The S&P 500 Index is one of the most commonly followed equity indices, and many consider it one of the best representations of the U.S. stock market, and a bellwether for the U.S. economy. It is comprised of 500 large companies having common stock listed on the NYSE or NASDAQ. The volatility (beta) of the account may be greater or less than the index. It is not possible to invest directly in this index.
Technical analysis is a method of evaluating securities by analyzing statistics generated by market activity, such as past prices and volumes. Technical analysis attempts to predict a future stock price or direction based on market trends. The assumption is that the market follows discernible patterns and if these patterns can be identified then a prediction can be made. The risk is that markets may not always follow patterns. There are certain limitations to technical analysis research, such as the calculation results being impacted by changes in security price during periods of market volatility. Technical analysis is one of many indicators that may be used to analyze market data for investing purposes and should not be considered a guaranteed prediction of market activity. The opinions expressed are those of BLI. The opinions referenced are as of the date of publication and are subject to change without notice. BLI reserves the right to modify its current investment strategies based on changing market dynamics or client needs.
Past performance is not indicative of future results. This material is not financial advice or an offer to sell any product. The information contained herein should not be considered a recommendation to purchase or sell any particular security. Forward-looking statements cannot be guaranteed.
Guardian Wealth Advisors, LLC (“GWA”) is an investment adviser registered with the U.S. Securities and Exchange Commission. Registration does not imply a certain level of skill or training. More information about GWA’s investment advisory services can be found in its Form CRS or Form ADV Part 2, which is available upon request.
GWA-24-88
