
In last month’s update I shared the story of a recent ex-client named “Don” who decided to self-manage his investment accounts. My intent in sharing his story was not to suggest he is incapable of self-management but rather that I believe his choice of timing may prove to be poor. I want to use his story to highlight how time can sometimes be an investors’ worst enemy.
As I explained last month, Don desires more growth for his investment accounts, specifically those earmarked for his children’s college educations. In this regard I believe time is working against him on two fronts. First, with both children in their mid-teens, I believe he feels like he needs to maximize their investment account returns over the next few years for when they will begin to use the money for college. If my presumption is correct, this feeling could be contributing to him making emotional investment decisions.
Second, I believe he is extrapolating past performance, specifically in the technology industry, into the future. I believe he expects above-average performance to continue, so as I shared last month, I presume he increased his risk to that sector expecting it will continue providing above-average returns. There are at least two potential problems I believe Don may be failing to consider that could derail his expectations.
First, history has proven that over the long-term, the stock market provides “average” returns. However, these average returns are comprised of longer-term periods of “above-average” returns and shorter-term periods of “below-average” returns. For many years the stock market has been providing “above-average” returns, especially stocks in the technology sector. So, is it a reasonable expectation that this sector will continue to provide the returns Don seeks during the window of time he needs?
Second, I believe that Don believes he must increase his investment risk to attempt to maximize his children’s account balances by the time they enter college. But is this the right time that he should be increasing his investment risk? Look at the following chart of S&P 500 Index.
STOCK MARKET, THE TREND:
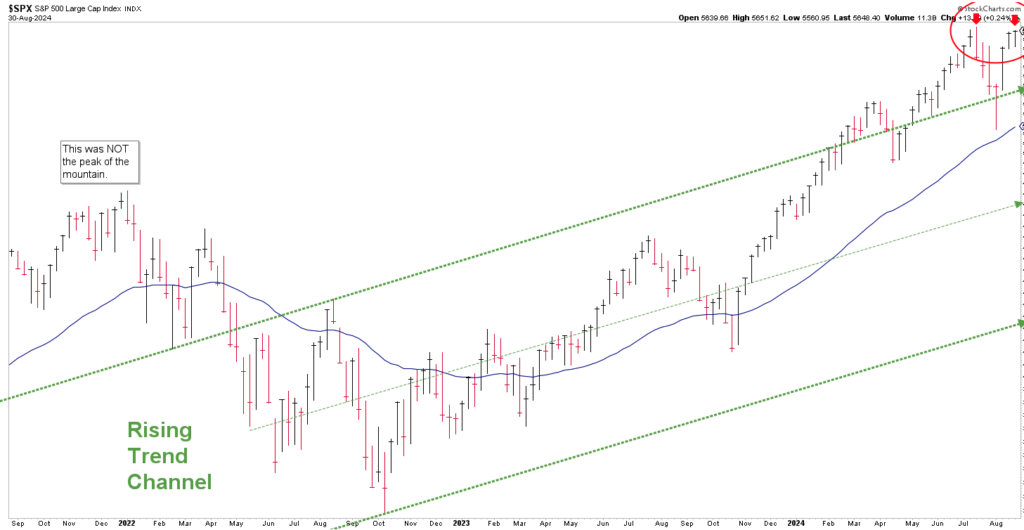
Chart courtesy of StockCharts.com
I believe there are times when investors should increase their investment risk in search of higher returns, but I’m not sure this is one of them. Looking at the far-right hand side of the chart, the S&P experienced a sharp decline during July with a sharp rebound during August. However, the behavior of the S&P 500 may be providing warning signs that Don is not aware of.
For instance, the S&P may have just completed a technical formation called an Adam-and-Eve double top. This type of technical formation forms at temporary stock market tops and is typically followed by shorter-term losses (up to 1-2 years). Therefore, increasing stock market risk now may not bear the fruit that Don is seeking in his window of time.
Second, the formation that took place in late 2021 that warned of potential losses in 2022 could be taking form once again. As I illustrated in chapter 5 of my book, Protecting The Pig: How Stock Market Trends Reveal the Way to Grow and Preserve your Wealth, there are 3 types of risks investors need to be watching for. The current top of the trend channel (the top, green-dashed line) could be nearing an intersection with both the Blue Line and Price in the coming months. If this happens, history suggests a Channel Correction could unfold, resulting in the stock market dropping 20-35% over a one-to-two-year period. This is precisely what happened in 2022, and it could be getting ready to happen again in 2025. Successive price movements over the weeks and months ahead should reveal the markets intent.
Returning to Don, let’s assume over the past couple of months he did in fact choose to increase his investment risk. In comparison, beginning early last week I started adding inverse Exchange-Traded Funds (ETFs) to client accounts to help reduce investment risk. Examples of this concept can be found in my book in chapter 7 titled, Two-Dimensional Investing. As I stated in the beginning of this article, I can’t help but think that Don’s window of time may be causing him to make emotional investment decisions by focusing on what seems to be the wrong investment metrics.
STOCK MARKET, WATCHING FOR THE SUMMIT:
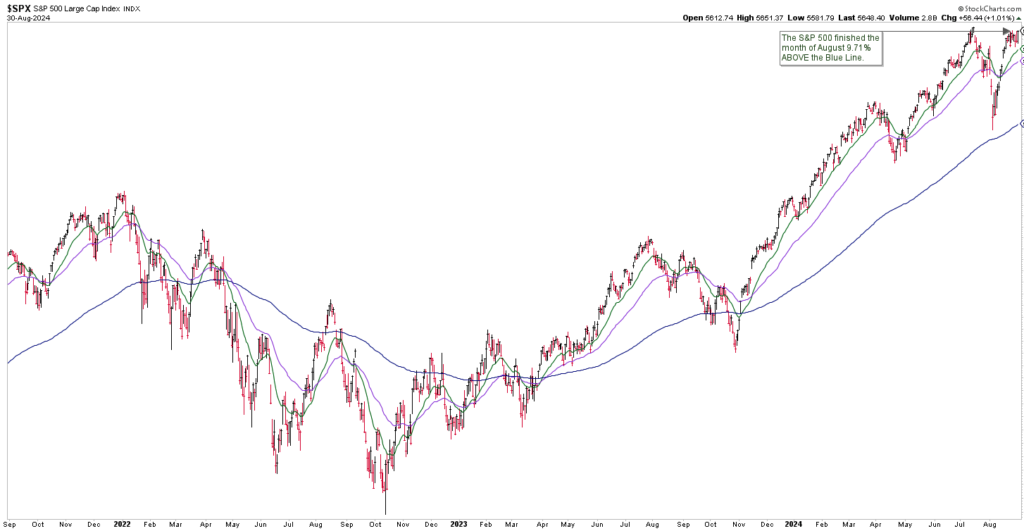
Chart courtesy of StockCharts.com
The S&P finished the month of August 9.71% above the Blue Line, compared to being 9.02% above the Blue Line at the end of July. Thank you for reading this update and please feel free to reach out with any questions.
Jeff Link
Disclaimers:
The BLUE LINE INVESTING® (BLI) investment process was founded on over 95 years of stock market history. It seeks to identify and align investment decisions with multiyear trends. Various aspects of this process have been illustrated in my book Protecting The Pig: How Stock Market Trends Reveal the Way to Grow and Preserve Your Wealth.
The S&P 500 Index is one of the most commonly followed equity indices, and many consider it one of the best representations of the U.S. stock market, and a bellwether for the U.S. economy. It is comprised of 500 large companies having common stock listed on the NYSE or NASDAQ. The volatility (beta) of the account may be greater or less than the index. It is not possible to invest directly in this index.
Technical analysis is a method of evaluating securities by analyzing statistics generated by market activity, such as past prices and volumes. Technical analysis attempts to predict a future stock price or direction based on market trends. The assumption is that the market follows discernible patterns and if these patterns can be identified then a prediction can be made. The risk is that markets may not always follow patterns. There are certain limitations to technical analysis research, such as the calculation results being impacted by changes in security price during periods of market volatility. Technical analysis is one of many indicators that may be used to analyze market data for investing purposes and should not be considered a guaranteed prediction of market activity. The opinions expressed are those of BLI. The opinions referenced are as of the date of publication and are subject to change without notice. BLI reserves the right to modify its current investment strategies based on changing market dynamics or client needs.
Past performance is not indicative of future results. This material is not financial advice or an offer to sell any product. The information contained herein should not be considered a recommendation to purchase or sell any particular security. Forward-looking statements cannot be guaranteed.
Guardian Wealth Advisors, LLC (“GWA”) is an investment adviser registered with the U.S. Securities and Exchange Commission. Registration does not imply a certain level of skill or training. More information about GWA’s investment advisory services can be found in its Form CRS or Form ADV Part 2, which is available upon request.
GWA-24-70

